
B2B SaaS Marketing Performance Report: H1 2025
H1 2025 wasn't just another six months of shifting ad dollars — it marked a fundamental reckoning with what actually drives pipeline. For years, B2B marketers chased volume metrics like addicts chasing a high. More MQLs meant success, right? But as budgets tightened and boards demanded proof of ROI, something had to give.The first half of 2025 became the moment when efficiency finally overthrew volume.
%20(2).png)
All HockeyStack Labs reports are done using anonymized HockeyStack customer data and cannot be used for any commercial use without written consent from HockeyStack. We did not partner with anyone on the creation of this report and it was not sponsored by a vendor. Reach out to emir@hockeystack.com with any questions.
The Efficiency Revolution
H1 2025 wasn't just another six months of shifting ad dollars — it marked a fundamental reckoning with what actually drives pipeline.
This report analyzes anonymized data from 177 B2B SaaS companies and approximately $240 million in ad spend, making it one of our most comprehensive looks yet at how marketers in 2025 are adapting to tighter budgets and rising efficiency demands.
For years, B2B marketers chased volume metrics like addicts chasing a high. More MQLs meant success, right? But as budgets tightened and boards demanded proof of ROI, something had to give. The first half of 2025 became the moment when efficiency finally overthrew volume as king.
The Search Monopoly Tightens Its Grip
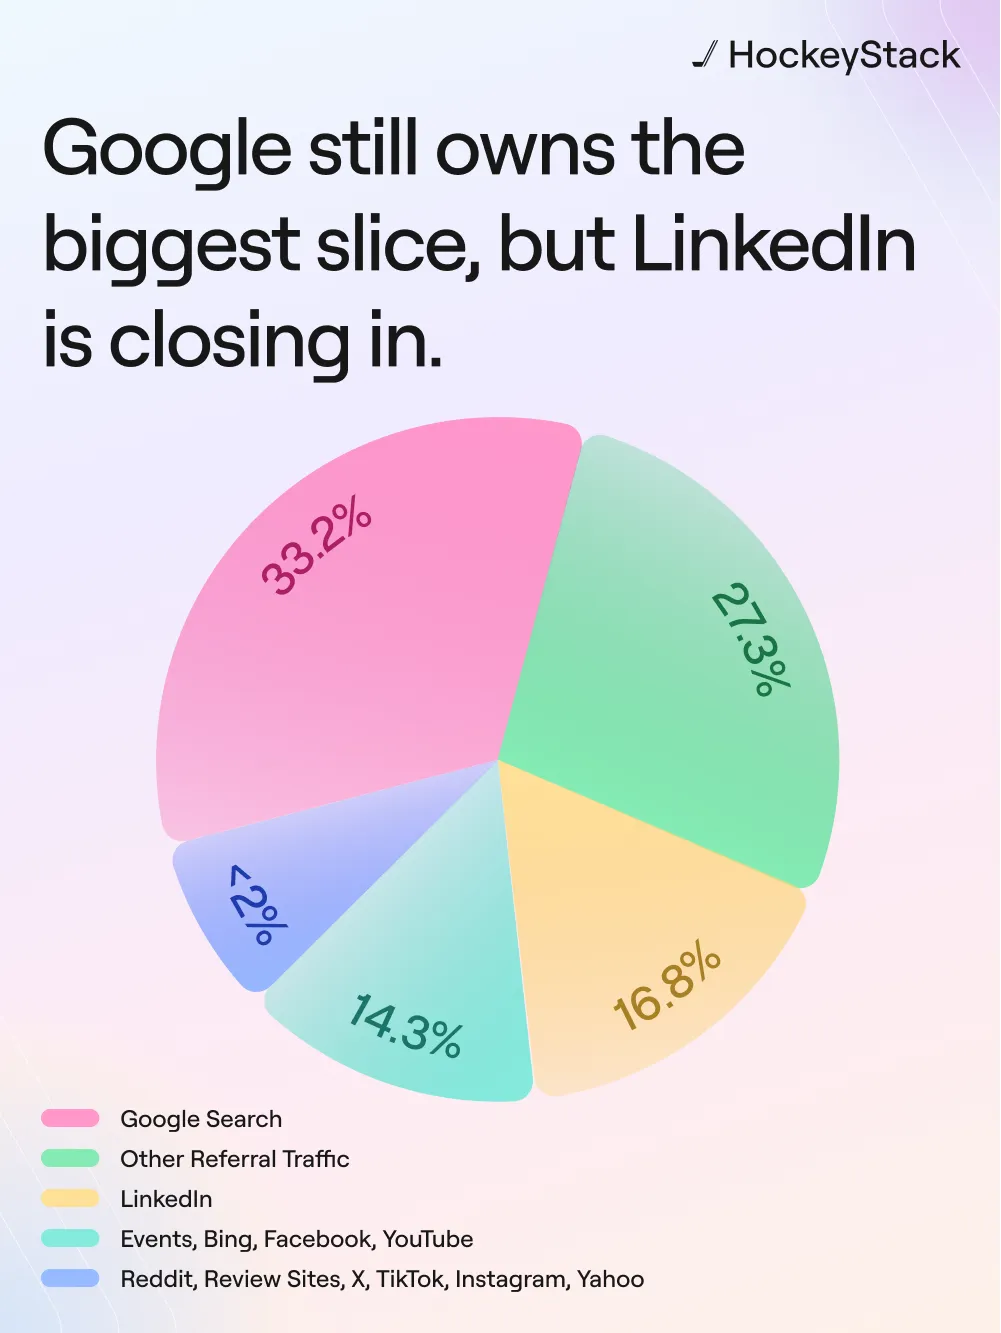
Google Search didn't just maintain its throne — it expanded its empire. Already commanding a massive 33.2% of total ad budgets (as shown in the pie chart above), it was clearly the undisputed king. But that wasn't enough.
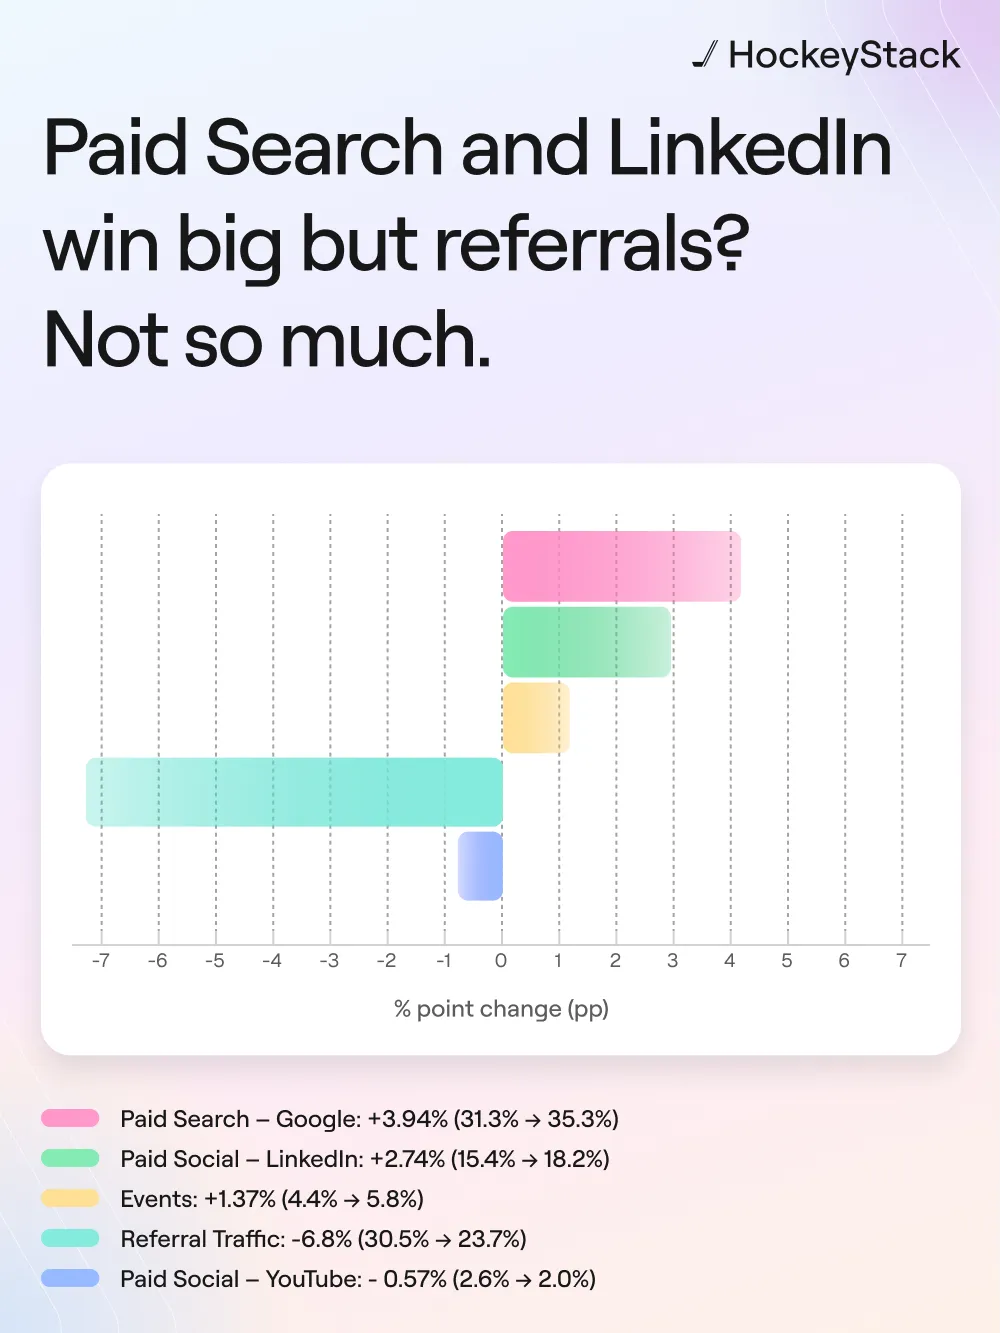
The Q2 momentum shift tells the real story: Google Search gained another 3.94 percentage points, surging from 31.3% to 35.3% of budgets. Meanwhile, Bing held steady at 3.9% overall. The message from marketers was clear: when seeking immediate pipeline, bet on high-intent search.
But here's the twist: while everyone poured money into search's promise, the conversion data would reveal that performance varies dramatically by channel purpose. Not every channel needs to close deals — some excel at opening doors.
The Great Referral Recalibration
Marketers sought more control over their pipeline destiny.
Look back at that first pie chart — Other Referral Traffic commanded a whopping 27.3% of H1 budgets, making it the second-largest slice. But by Q2, marketers recalibrated. The budget shift chart shows a significant adjustment: a 6.8 percentage point shift from 30.5% to 23.7% — the largest reallocation of any channel.
After years of partnership programs and content syndication, teams wanted more direct control over their pipeline generation. They sought channels where they could measure impact, optimize in real-time, and demonstrate clear attribution.
The data would later reveal these referral channels delivered exceptional conversion rates. But in a world demanding predictability and control, even high-performing channels faced scrutiny.
LinkedIn's Strategic Evolution
The platform is finding its true calling in the B2B marketing mix.
The platform's trajectory tells a story of strategic refinement. Starting at 16.8% of overall H1 spend (third place in our pie chart), LinkedIn then surged in Q2, gaining 2.74 percentage points to jump from 15.4% to 18.2% of budgets.
This investment makes perfect sense when you consider LinkedIn's unique value: where else can you precisely target "VP of Sales at Series B SaaS companies with 50-200 employees"? The budget shifts show marketers aren't abandoning LinkedIn — they're learning to leverage it differently.
The May ACV spike, where LinkedIn drove 89.7% of closed-won revenue, reveals its superpower: landing enterprise whales. Perhaps it's time we stopped expecting LinkedIn to be everything to everyone and instead celebrated it for what it does best — building brand awareness and occasionally delivering those game-changing enterprise deals.
The Events Renaissance
Just when we thought virtual had won, in-person roared back.
Hidden in the middle of that pie chart at around 5% of spend, Events might seem like a minor player. But the Q2 shift data reveals the real story: a healthy 1.37 percentage point increase from 4.4% to 5.8%.
After years of "virtual event fatigue" and half-hearted hybrid attempts, marketers rediscovered what they'd lost: genuine human connection. The February data backs this up — events contributed 18.5% of closed-won revenue that month. Nothing replaces face-to-face conversations when it comes to building enterprise relationships.
Understanding Channel Roles
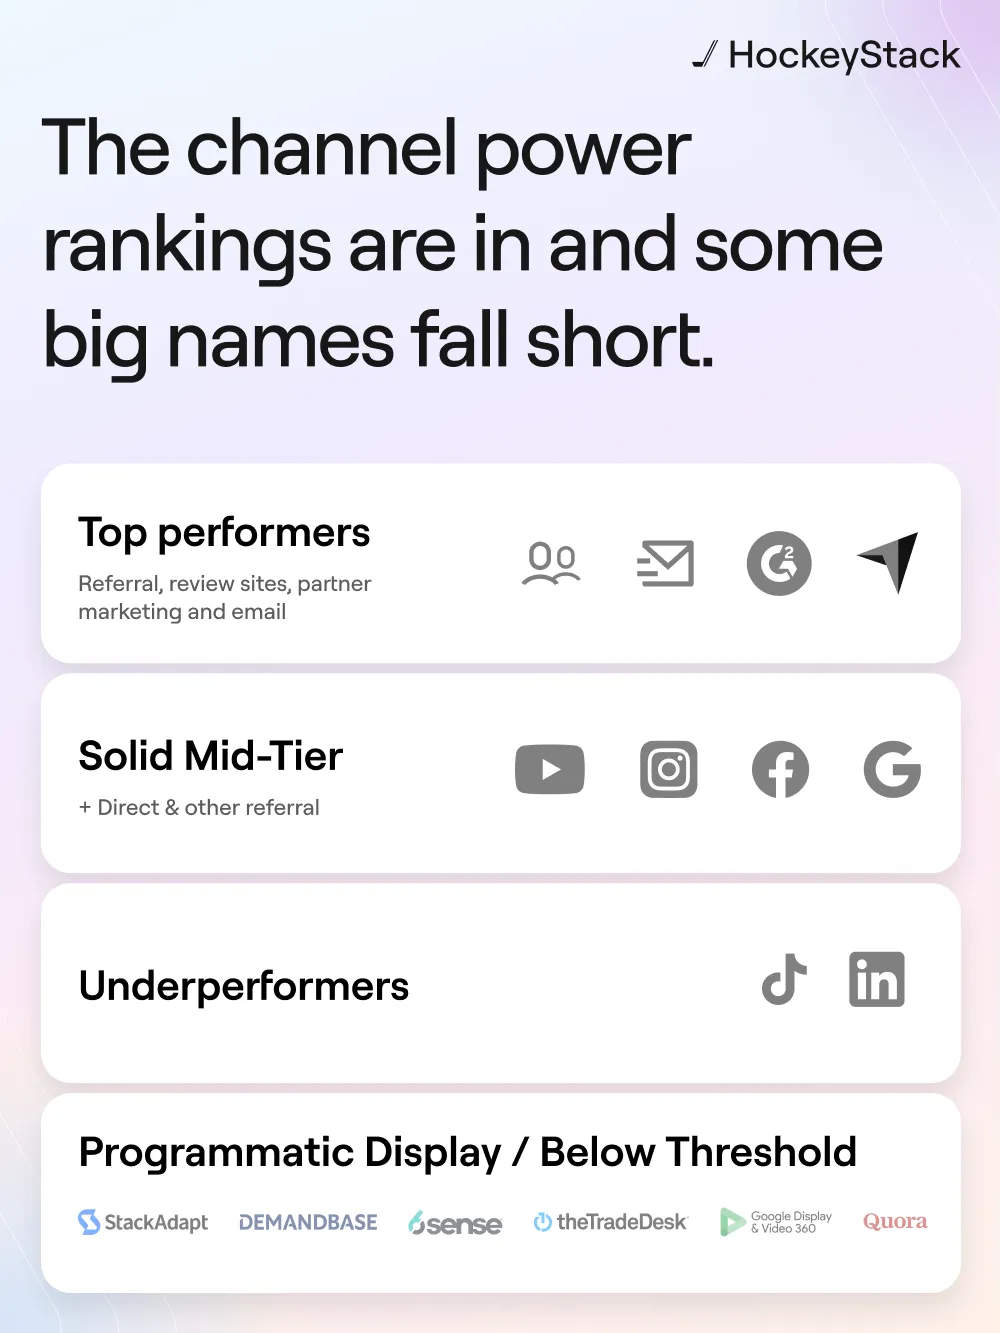
When we tier channels by funnel efficiency (MQL→SQL→CW), a nuanced story emerges about channel specialization:
Top Performers excel at conversion and pipeline quality:
- Referral (the conversion champion)
- Review Sites/Marketplaces
- Partner Marketing
- Email (the reliable workhorse)
Solid Mid-Tier contributors balance reach and conversion:
- YouTube, Instagram, Facebook
- Direct traffic
- Google Search (massive reach with decent conversion)
- Other Referral Traffic
Awareness & Top-of-Funnel Specialists:
- LinkedIn (exceptional reach, enterprise deal potential)
- TikTok (strong MQL generation, emerging B2B presence)
Below Threshold — the programmatic display complex (StackAdapt, Demandbase, 6sense, TradeDesk, DV360, Quora) — these platforms are still finding their footing in the performance marketing mix.
This tiering reveals an important truth: not every channel needs to excel at conversion. LinkedIn and TikTok generate awareness and fill the top of the funnel, while channels like Email and Partner Marketing efficiently convert that interest into revenue. It's an ecosystem, not a competition.
The Quality Revolution
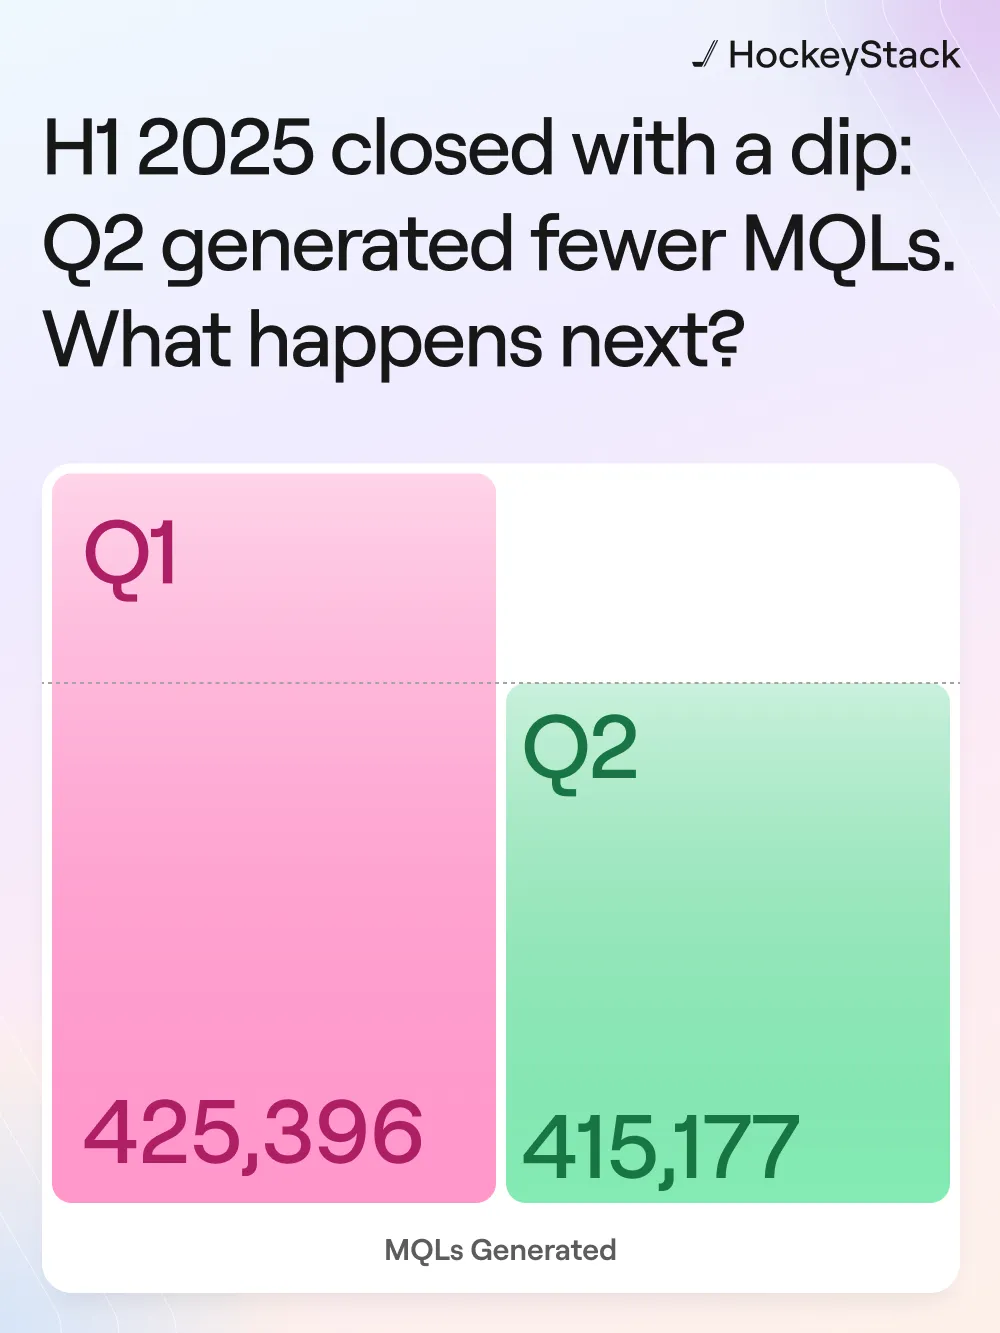
Q2 2025: The quarter where less became more. The MQL chart shows an interesting shift — Q2 generated 415,177 MQLs versus Q1's 425,396, a modest decline of 10,219 leads (-2.4%). But this tells only part of the story.
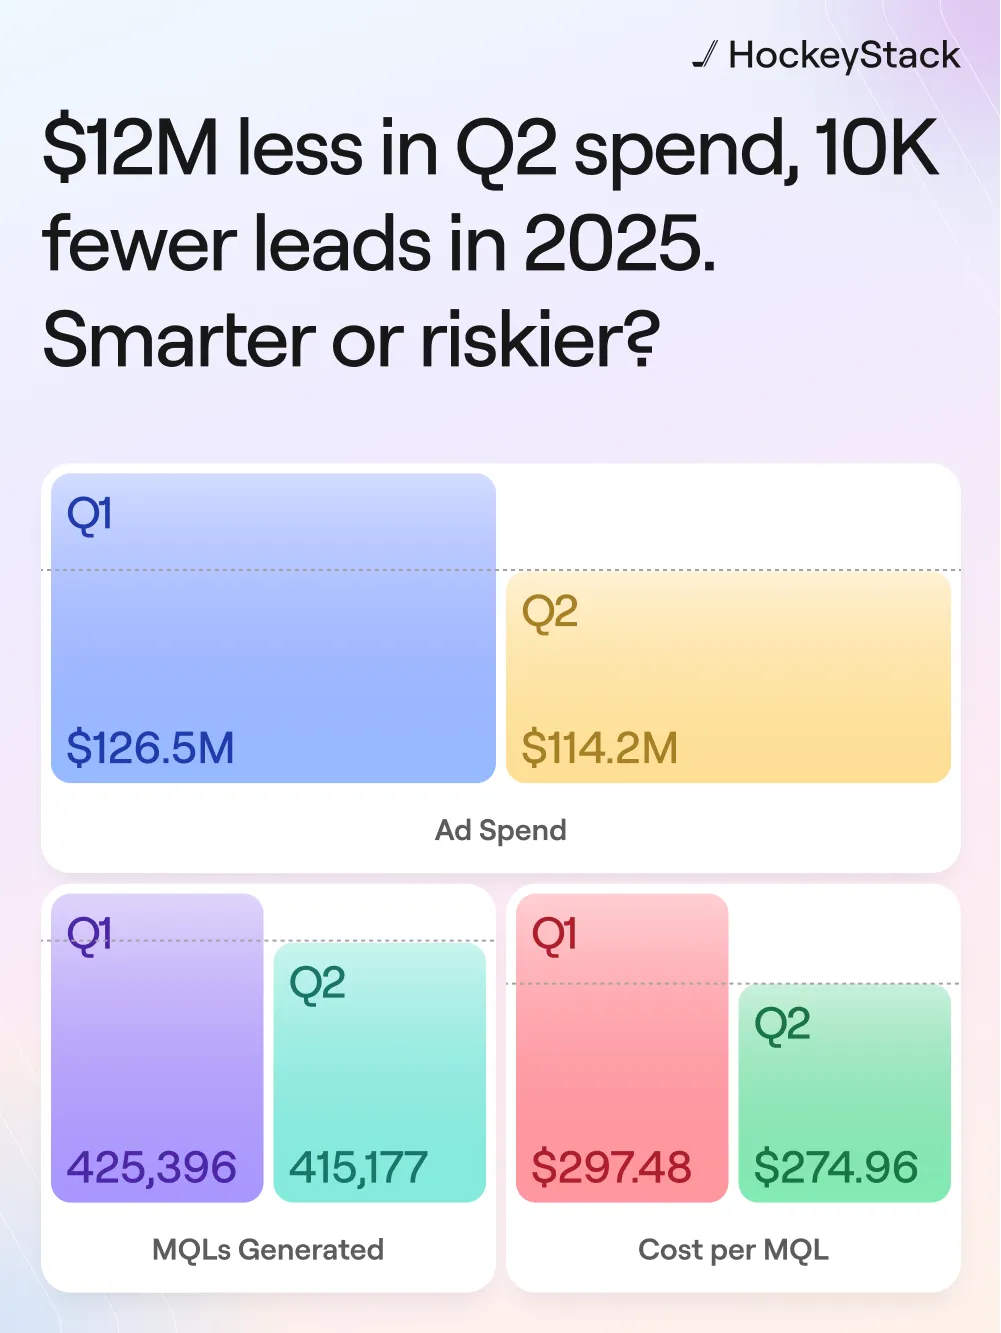
The three-panel comparison reveals the efficiency gains:
- Ad spend decreased from $126.5M to $114.2M (-9.7%)
- MQLs declined only slightly (-2.4%)
- Cost per MQL improved from $297.48 to $274.96 (-7.6%)
Teams achieved more efficient lead generation through smarter channel allocation and better targeting.
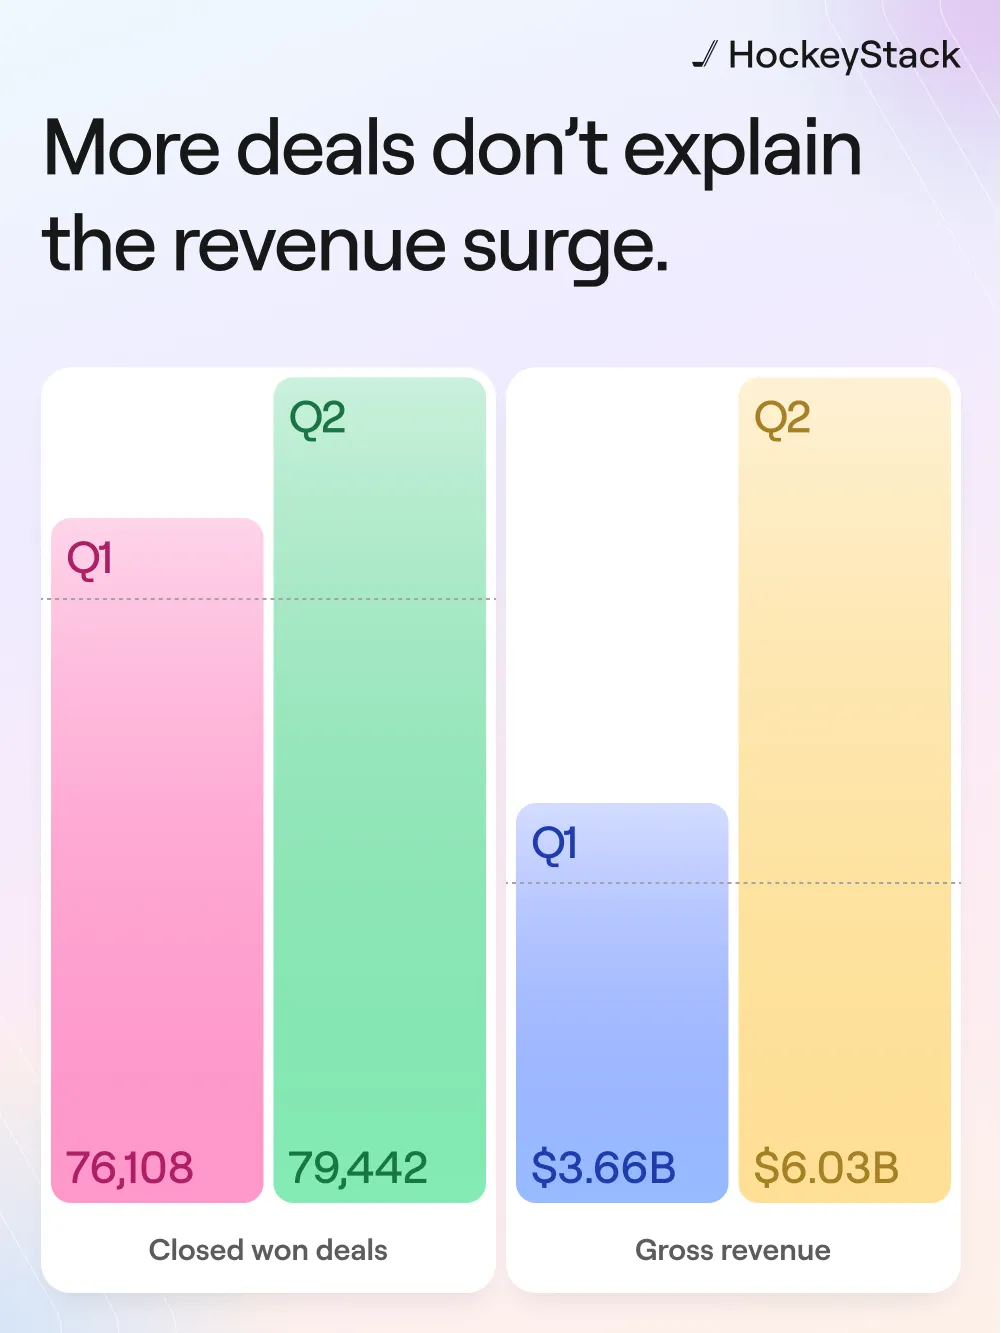
The real victory appears in business outcomes:
- Closed-won deals increased from 76,108 to 79,442 (+4.4%)
- Gross revenue surged from $3.66B to $6.03B (+65%)
The bars tell a story of transformation: slightly more deals, significantly more revenue. Average deal sizes skyrocketed in Q2, validating the strategy of quality over quantity.
The ACV Attribution Story
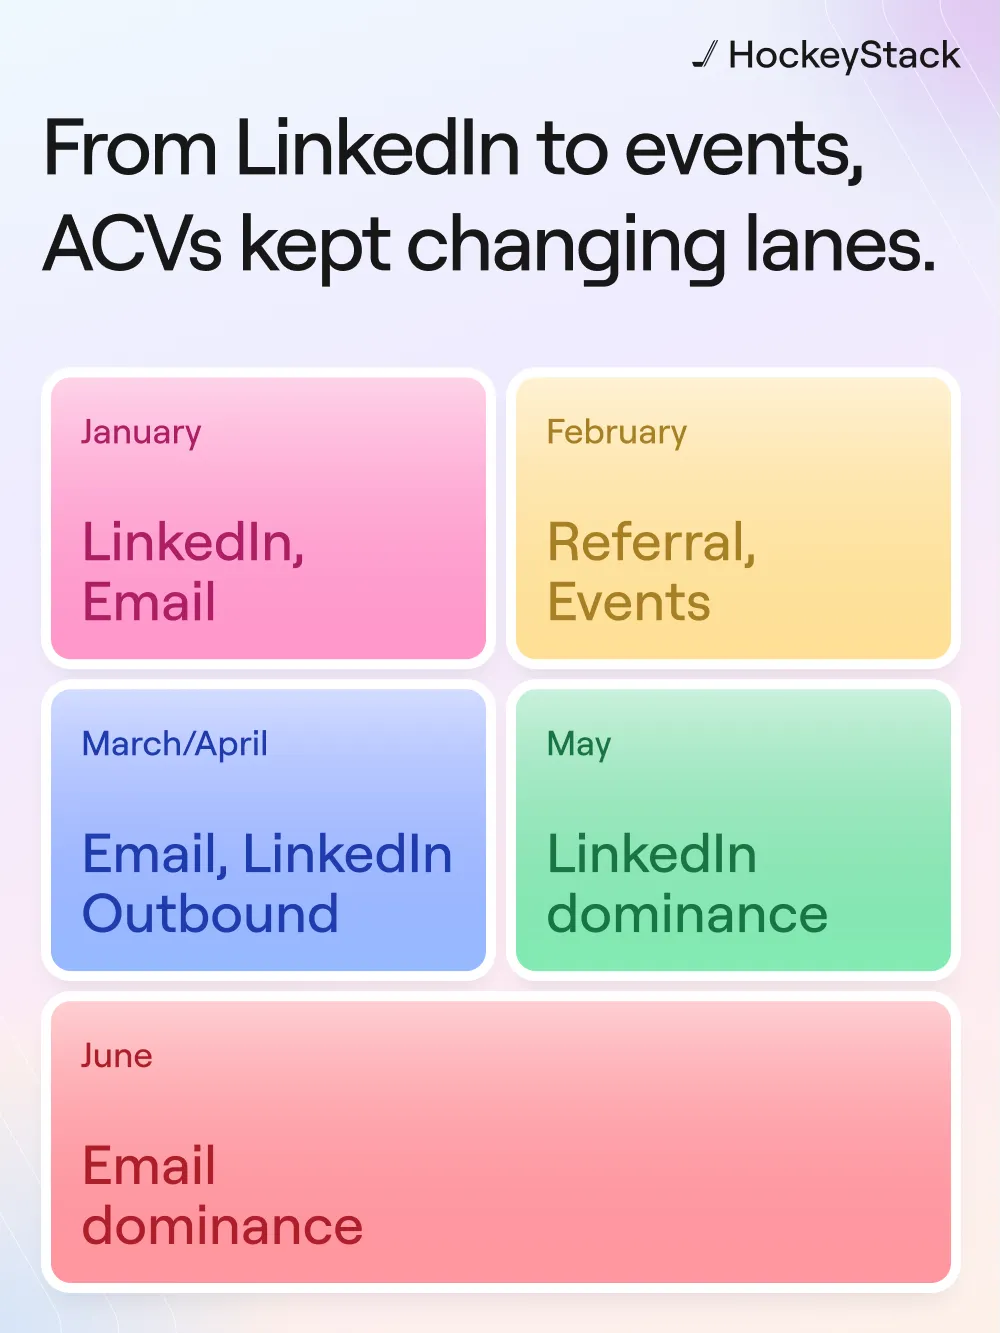
The monthly ACV attribution chart reveals the dynamic nature of B2B revenue generation. Each month saw different channels stepping up:
- January: LinkedIn and Email shared the spotlight
- February: Referral and Events drove value
- March/April: Email and LinkedIn returned, with Outbound joining
- May: LinkedIn's enterprise focus delivered massive returns
- June: Email demonstrated its consistency
This variation isn't chaos — it's the natural rhythm of B2B sales. Enterprise deals (often influenced by LinkedIn) come in waves, while Email provides steady, reliable pipeline month after month. Smart marketers plan for this volatility rather than fighting it.
The Strategic Reframe
H1 2025 taught us that channel success isn't one-size-fits-all.
The visuals tell a story of specialization:
- Google Search (33.2% of budget) drives high-intent traffic at scale
- LinkedIn (growing to 18.2%) builds brand awareness and lands enterprise deals
- Referral programs deliver exceptional conversion when properly managed
- Email remains the consistent converter, quietly driving revenue
Each channel plays a distinct role in the customer journey. LinkedIn might not convert at the rates of Email or Referral, but those channels can't match LinkedIn's ability to reach decision-makers at scale or occasionally land seven-figure enterprise deals.
The Path Forward
The data visualizations from H1 2025 paint a picture of marketing maturity: understand each channel's strength and optimize accordingly.
The Q2 results proved you can:
- Reduce spend by 10%
- Generate slightly fewer but higher-quality MQLs
- Increase closed-won deals by 4.4%
- Grow revenue by 65%
Success comes from accepting that:
- LinkedIn excels at awareness and enterprise deals, not volume conversion
- Google Search provides scale and intent
- Referral/Partner channels deliver quality when you can manage the complexity
- Email remains your reliable revenue generator
- Events are back and driving real relationships
The question for H2 isn't about picking winners and losers — it's about orchestrating a channel mix where each player performs their role excellently. The marketers who recognize this will be the ones celebrating at year-end.