The State of Google Ads: Performance & Strategy for 2025

Introduction
Search has recently become a contentious topic in B2B. Some argue that SEO is slowing down, that buyers are shifting their discovery behavior to social platforms, or that Google is too crowded and too expensive to justify meaningful investment. On the other hand, others treat paid search as a default line item rather than a strategic channel. The truth is, both sides of the debate often rely more on sentiment than on data.
This report exists to bring clarity to that conversation — not to champion Google or dismiss alternatives, but to understand what actually happens when buyers move through real B2B funnels in 2025.
Across nine months of funnel and touchpoint data from more than 200 companies, one pattern stood out strongly enough that it warranted a focused, objective deep dive: Google Ads consistently influences revenue with stability and efficiency. That doesn’t make it perfect, and it doesn’t make other channels ineffective. But it does mean that Google plays a structurally different role in the buyer journey than social, syndication, or display — a role worth unpacking with precision rather than assumption.
And, if SEO sometimes feels abstract or slow to prove its value, paid search offers a useful counterpoint. Whatever marketers may feel about search being “saturated” or “past its prime,” the ROI of Google Ads shows that buyers continue to rely on Google at the moments of evaluation that directly precede revenue.
This report breaks down that story in four parts:
- Overall funnel performance: how Google generates intent and preserves efficiency across the full funnel.
- Cross-channel comparison: how its behavior differs from LinkedIn, Meta, YouTube, and syndication, and where each channel excels or struggles.
- Segment dynamics: how Enterprise, Mid-Market, and SMB buyers interact differently with search.
- Incremental lift: the measurable impact Google has on accelerating and validating deals.
The goal isn’t to crown a winner. It’s to understand the mechanics of how search works in today’s B2B landscape, and why its role looks different from every other paid channel in the mix.
Methodology & Definitions
In this report, we benchmark the performance of Google Ads and compare it to other major paid engines (LinkedIn, Facebook, Content Syndication, YouTube, Bing, and generic paid social/search) to understand how it performs across conversion rates, deal quality, and Closed-Won efficiency.
All findings are based on anonymized HockeyStack data from 198 B2B SaaS companies across North America and EMEA, representing one of the most comprehensive datasets available on paid pipeline performance today.
What is “Paid Google”?
For this report, we categorize “Paid Google” as any paid media run through Google’s advertising ecosystem, excluding YouTube, which we’ve broken out as a separate channel. Our categorization includes:
- Search Ads: Paid text ads that appear on Google search results when users search for relevant keywords.
- Display Ads: Visual banner ads shown across websites in Google’s Display Network to drive awareness or retarget visitors.
We broke out YouTube as a separate channel because its behavior differs meaningfully from other Google surfaces:
- Video-first format commanding a longer attention span
- Operates more like a content consumption channel,
- Doesn’t capture explicit intent the way search does (people typically encounter YouTube ads while watching unrelated or entertainment-driven videos)
Identifying Google-influenced deals
All Google-influenced deals were identified using HockeyStack’s Marketing Intelligence product. Customers use this platform to track attributed deals over time, monitor channel performance, and evaluate revenue impact. For this report, we aggregated data from these customer dashboards to understand cross-channel performance across the entire dataset.
Attribution Model
We used linear attribution to assign equal credit to every touchpoint in a deal’s journey. This model ensures:
- No assumptions about where Google appears in the funnel
- Fair comparison across different sales cycles and GTM motions
- Normalization of companies with varying channel mixes
- Consistency across PLG, hybrid, and enterprise sales motions
Outlier Removal
Outliers were removed manually on a case-by-case basis. This included:
- Companies that had not completed onboarding or established consistent channel definitions
- Instances where a channel was misconfigured or missing core touchpoint data
This ensured data integrity without applying blanket filters that could distort funnel behavior.
Data Aggregation
Once clean data was established, we aggregated all attributed deals, touchpoints, funnel stages, and conversion outcomes across the entire customer base. Channel influence was then benchmarked by:
- Deal creation rate
- Qualification efficiency
- Closed-Won conversion
- Incremental lift on progression and closing
This process enabled us to compare Google’s performance to LinkedIn, Meta, YouTube, content syndication, and other paid channels across segments and time periods.
Deal Stages:
- Deals Created: Any opportunity entered into CRM, regardless of source or quality
- Deals Qualified: Opportunities that met company-specific qualification criteria. If the organizations uses two levels of qualification (e.g. MQL and SQL), the second level of qualification was used (e.g. SQL)
- Closed Won: Completed deals with signed contracts and recognized revenue
Company Segments:
- SMB: 1-99 employees
- Mid-Market: 100-999 employees
- Enterprise: 1000+ employees
The Dataset
- Sample Size: 198 B2B SaaS companies
- Time Period: January 2025 - October 2025 (10 months)
- Regions: North America and Europe primarily
- Total Spend: $150,134,261.97
Part I — Overall Performance of Google Ads in 2025
When we look across every paid channel in the dataset, one pattern stands out: Google Ads consistently combines scale and efficiency. While other channels can spike and dip depending on creative performance, budgets, or targeting pools, Google often behaves like a stabilizer. It generates high-intent volume and converts that volume at rates that remain steady even when spend fluctuates.
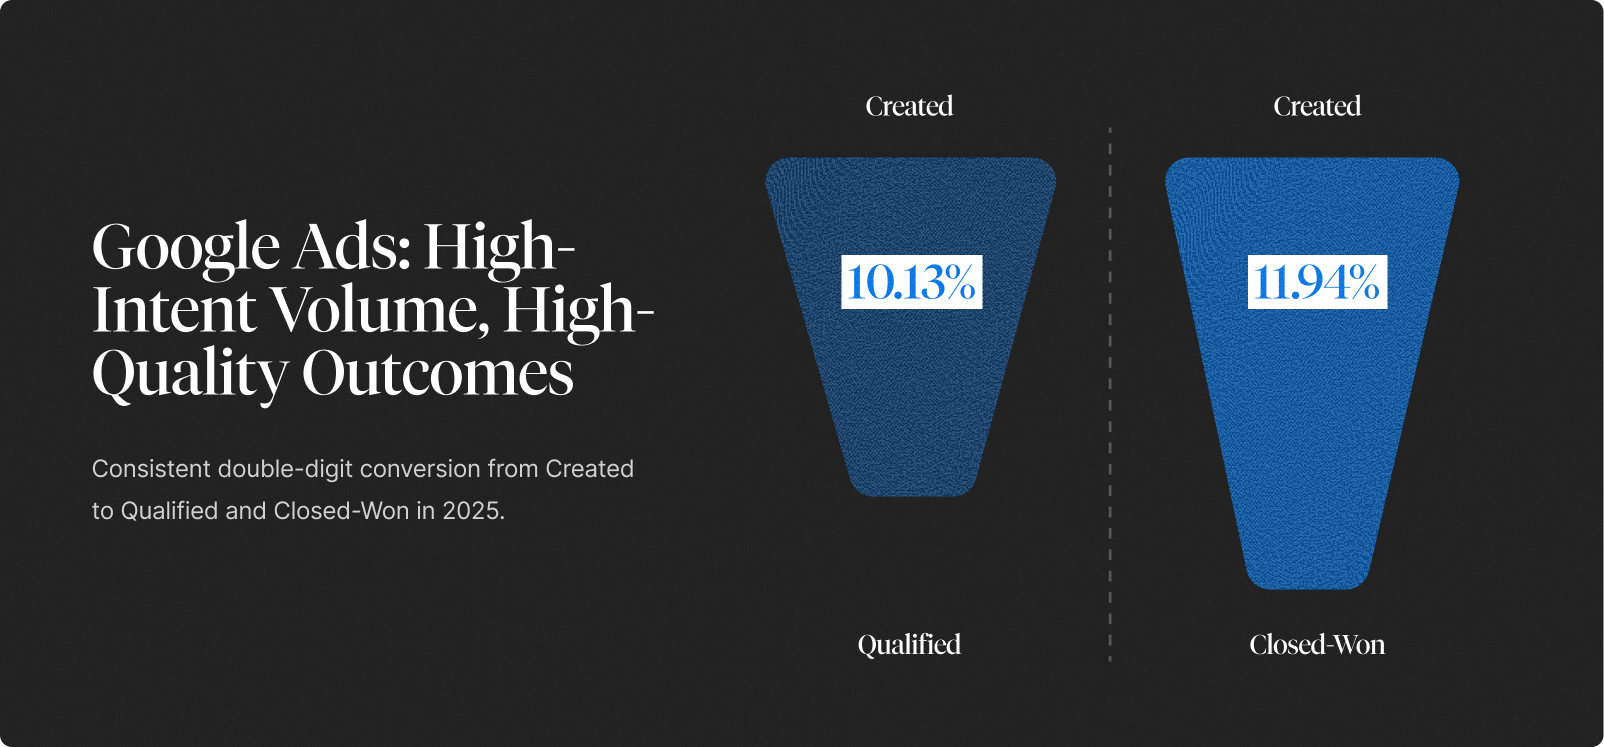
Across the dataset:
- 10.13% of Google Ads–influenced deals were Qualified
- 11.94% became Closed-Won
These numbers may appear modest out of context, but in paid acquisition, especially at Google’s scale, they’re exceptionally strong. Across more than 200 companies and nine months of data, Google Ads influenced 12,062 Closed-Won deals, more than any other paid channel. It generated 3× more Closed-Wons than Facebook and nearly 6× more than Content Syndication.
What’s most notable is that Google’s funnel barely erodes. The 10.13% → 11.94% progression is almost linear, which is extremely rare in B2B SaaS. Most paid channels show dramatic drop-offs between early interest and late-stage deals; Google does not. Intent that enters early tends to persist all the way through revenue.
This reflects what we consistently see in HockeyStack’s attribution data:
Channels that capture intent produce stable funnels. Channels that manufacture awareness produce volatile ones.
Sidebar: Why Close Rates Can Be Higher Than Qualification Rates
Linear attribution measures presence, not funnel progression. Closed-Won journeys have more touches and more validation searches — especially branded searches — which is where Google shows up. As a result, the Closed-Won percentage can appear slightly higher than the qualification percentage. This isn’t an error; it reflects Google’s tendency to re-enter later stages of the journey.
Part II — How Google Ads Compares to Other Advertising Channels
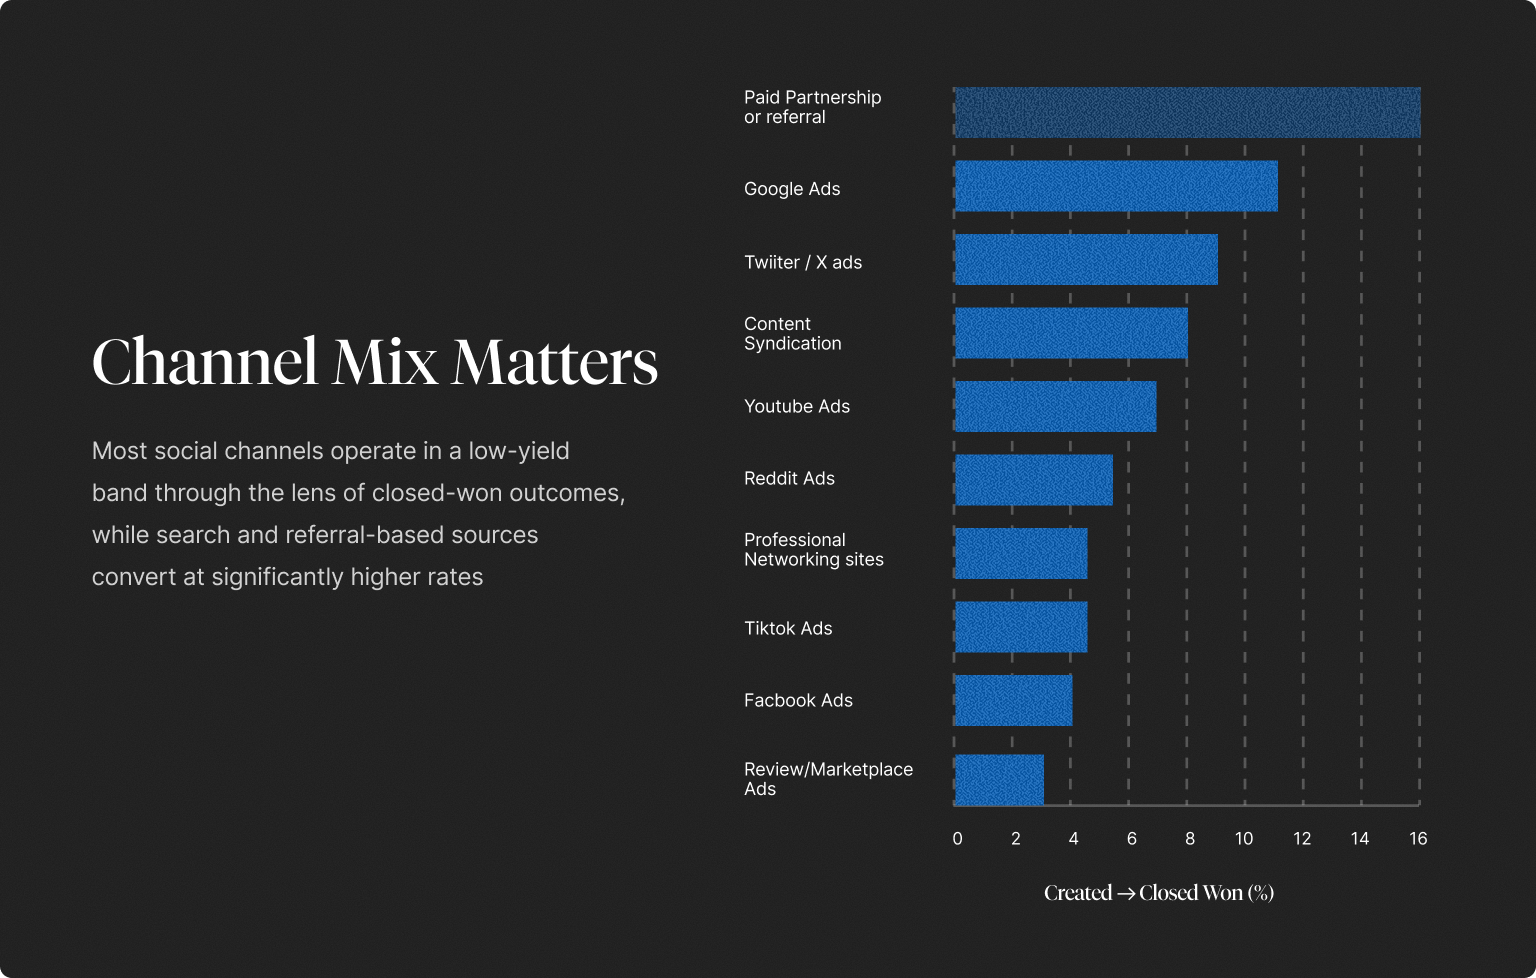
To understand the real strength of Google Ads in 2025, it’s not enough to evaluate it in isolation. Its performance becomes far more meaningful once it’s compared to the other major paid channels in the dataset — namely, professional networking sites, Meta, Content Syndication, and YouTube.
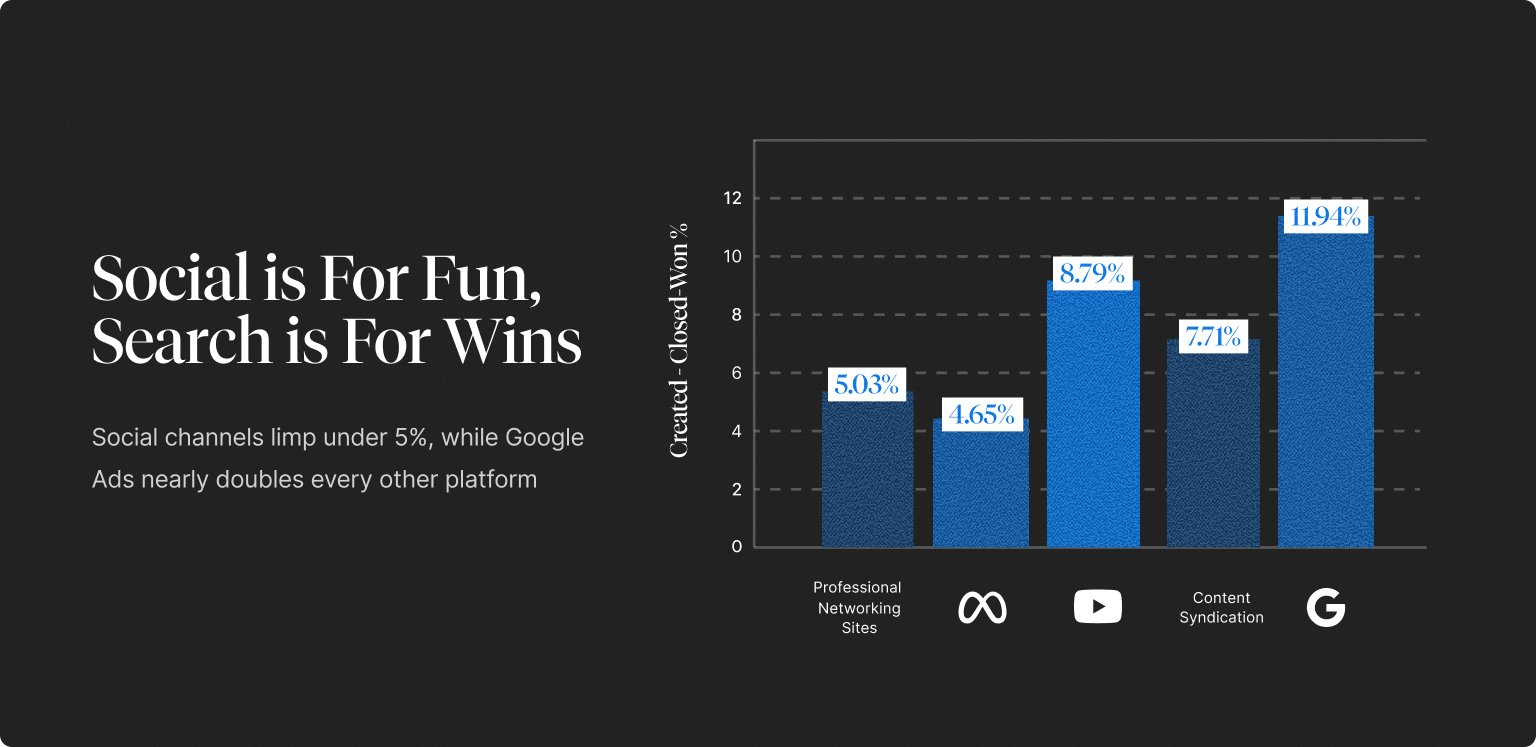
Across all of them, Google is the only channel that delivers volume, funnel efficiency, and consistency at the same time. The contrast becomes immediately clear once we look at how each channel behaves.
LinkedIn Ads drive significant scale. Its 2025 performance:
- 5.20% Created → Qualified
- 5.03% Created → Closed-Won
This gives LinkedIn lower “efficiency” than other channels in the dataset. However, the data show’s it’s excellent for visibility and early-stage interactions, but as we all know, intent doesn’t always translate into late-funnel momentum.
Our hypothesis: LinkedIn captures buyers before they enter an active buying cycle, while Google captures them at the moment of evaluation.
Meta Ads show a different pattern. They perform surprisingly well at the top of the funnel but lose nearly all efficiency later:
- 11.26% Created → Qualified
- 4.65% Created → Closed-Won
This ~60% drop between qualification and Closed-Won is one of the steepest cliffs in the dataset. Meta creates interest, familiarity, and retargeting opportunities, but stops short at revenue capture.
YouTube mirrors what we’d expect from an upper-funnel influence channel:
- 5.08% Created → Qualified
- 7.71% Created → Closed-Won
It contributes meaningful revenue over time, but movement through the funnel is slower and more dispersed. YouTube introduces the brand; Google Search closes it.
Content Syndication sits in the middle. Its performance is more balanced:
- 7.03% Created → Qualified
- 8.79% Created → Closed-Won
While it beats both LinkedIn and Facebook at the bottom of the funnel, its primary challenge is volatility. Depending on the partner and month, lead quality can shift significantly.
It’s worth pointing out that quality and appeal of content is a hugely important variable that is impossible to objectively measure in a dataset like this, but the general takeaway is this: syndication behaves more like a pipeline filler. It adds volume, but it rarely brings in the high-intent buyers that Google consistently generates.
When we examine month-over-month behavior, the differences become even clearer. Google’s qualification and close rates stay within tight, predictable bands:
- ~8–16% monthly qualification
- ~9–21% monthly Closed-Won
Contrast that with Facebook & Instagram, and we see dramatic swings between 1.06% → 27.48% month to month. Again, creative performance or algorithm shifts can shift performance dramatically, but Google’s stability is rare among paid channels.
These swings matter — especially in an efficiency-focused market. Predictable channels aren’t just easier to forecast; they’re easier to defend in budget conversations.
The Takeaway: Google Is The Reliability Layer of Paid Acquisition
Every channel in the dataset has a clear purpose — awareness, nurture, reach, retargeting, or pipeline filling. Googe’s purpose is clear — it operates and delivers consistently, like infrastructure.
Google Ads delivers meaningful volume while converting at both the top and bottom of the funnel. While other channels show volatility, drop-off, or a structural weakness, Google behaves like the foundation of paid acquisition — the part you build on, not the part you experiment with.
Part III — Segment Dynamics and Seasonal Trends in 2025
Google Ads continues to be the most stable paid engine across the dataset, but 2025 data makes one thing clear: stability doesn’t look the same across company sizes. Enterprise, Mid-Market, and SMB buyers all respond to Google differently — not because of the channel itself, but because their buying behavior, budgets, and internal processes shape how efficiently they move through the funnel.
At a high level, Enterprise maintains strong late-funnel reliability, Mid-Market emerges as the most incrementally efficient segment, and SMB experiences one of the sharpest disconnects between interest and revenue. Google delivers for all three — but in three very different ways.
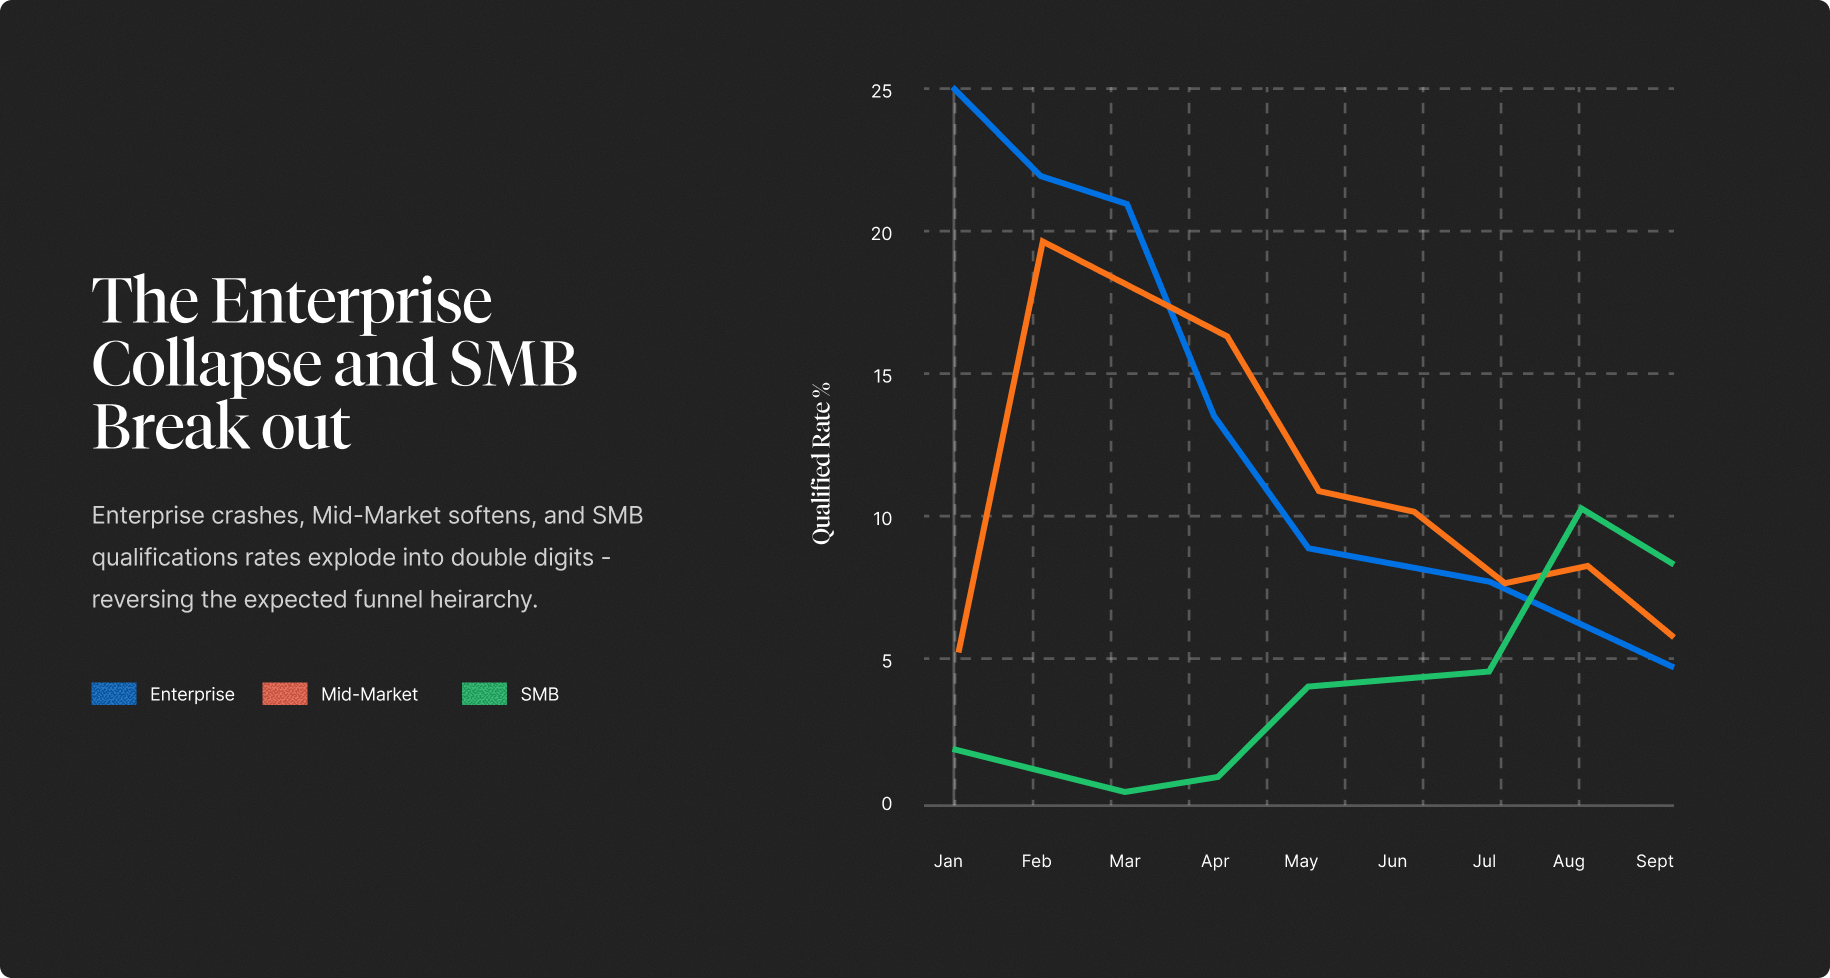
Enterprise: Strong Commitment Early, Caution Later
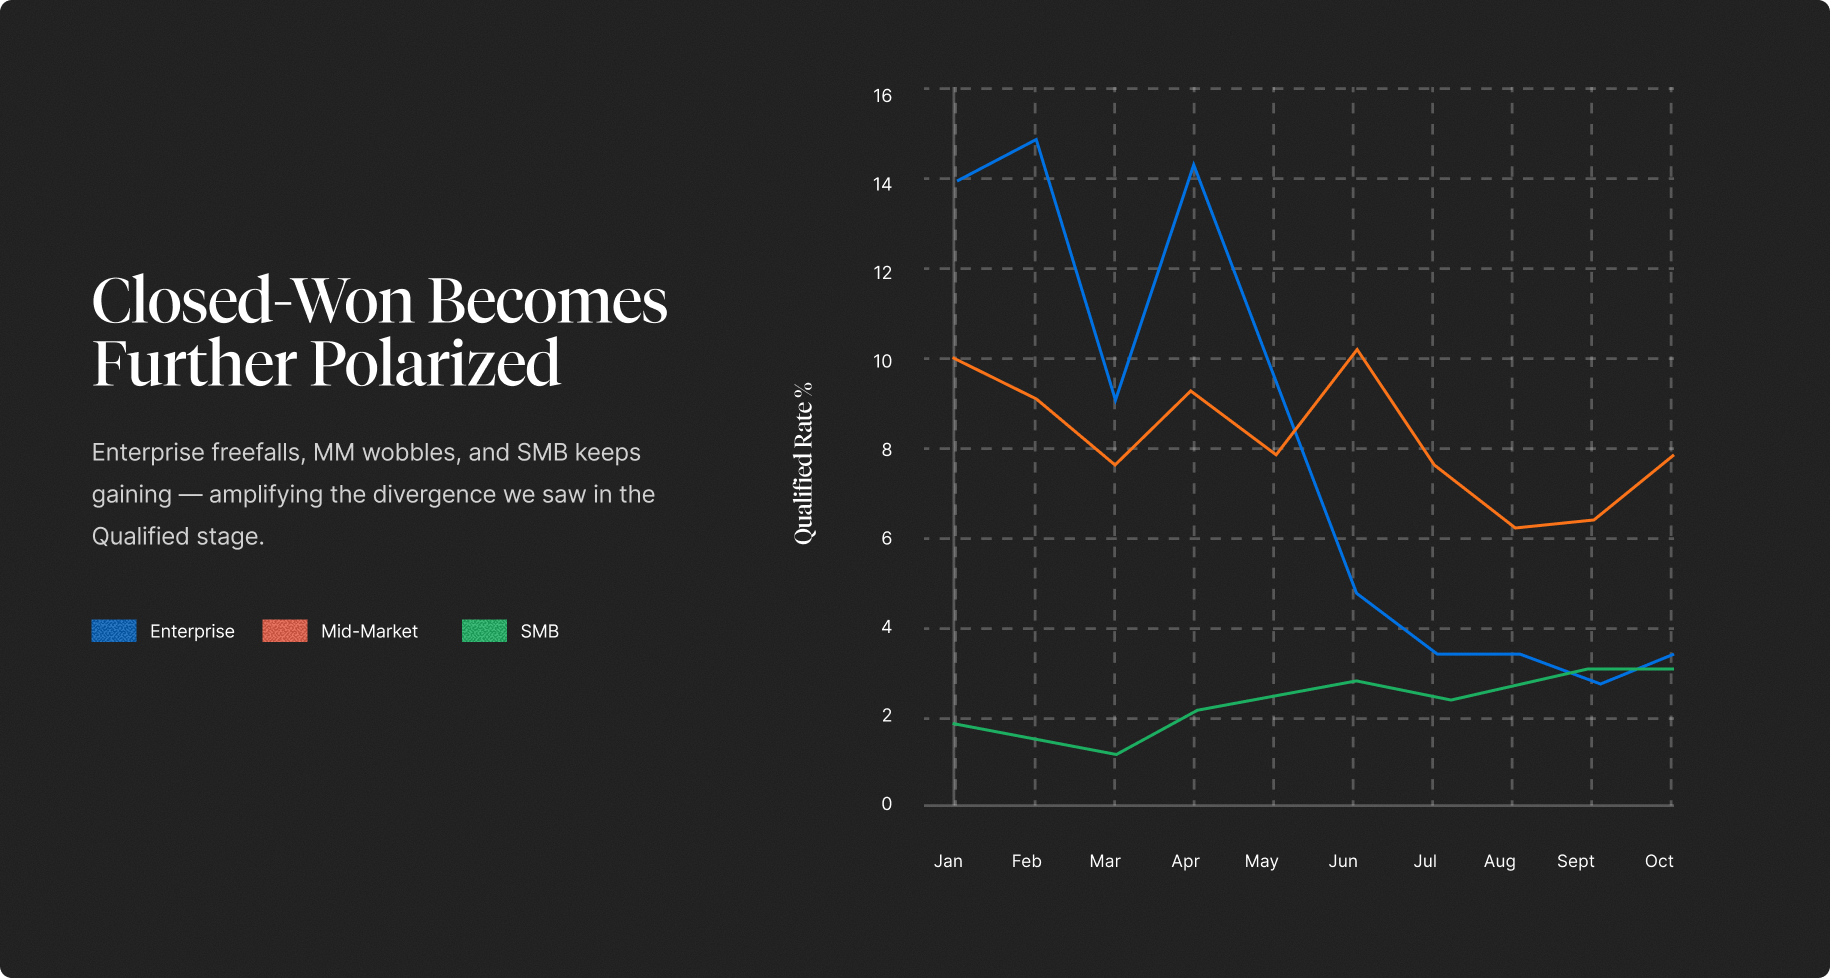
Enterprise buyers came out of the gate fast in 2025. In Q1, qualification rates routinely hit the 20–25% range before cooling to around 8% by mid-year and drifting under 5% by early fall. Close-Won efficiency, however, barely budged, holding at roughly 7.5% throughout.
This pattern mirrors classic enterprise fiscal behavior: January through March are flush with budget, pipeline targets, and structured evaluation cycles, producing a surge of early-funnel activity. But by summer, budgets tighten, stakeholder groups expand, and the bar for qualification rises dramatically. What’s interesting is that the deals that do make it through qualification convert at the same rate, even as the top of the funnel softens. This suggests enterprises aren’t losing interest, they’re simply becoming becoming more selective.
Google holds up unusually well in this environment. Other channels, especially LinkedIn, showed similar early-year energy but fall off faster as budgets contract. Content syndication remained present in enterprise journeys but showed far greater volatility and significantly weaker close efficiency. Google, by contrast, continued to appear in late-stage search and validation moments — even when top-of-funnel volume cools — which helps preserve Enterprise close rates despite the mid-year slowdown.
SMB: Intent Surges, but Infrastructure Struggles
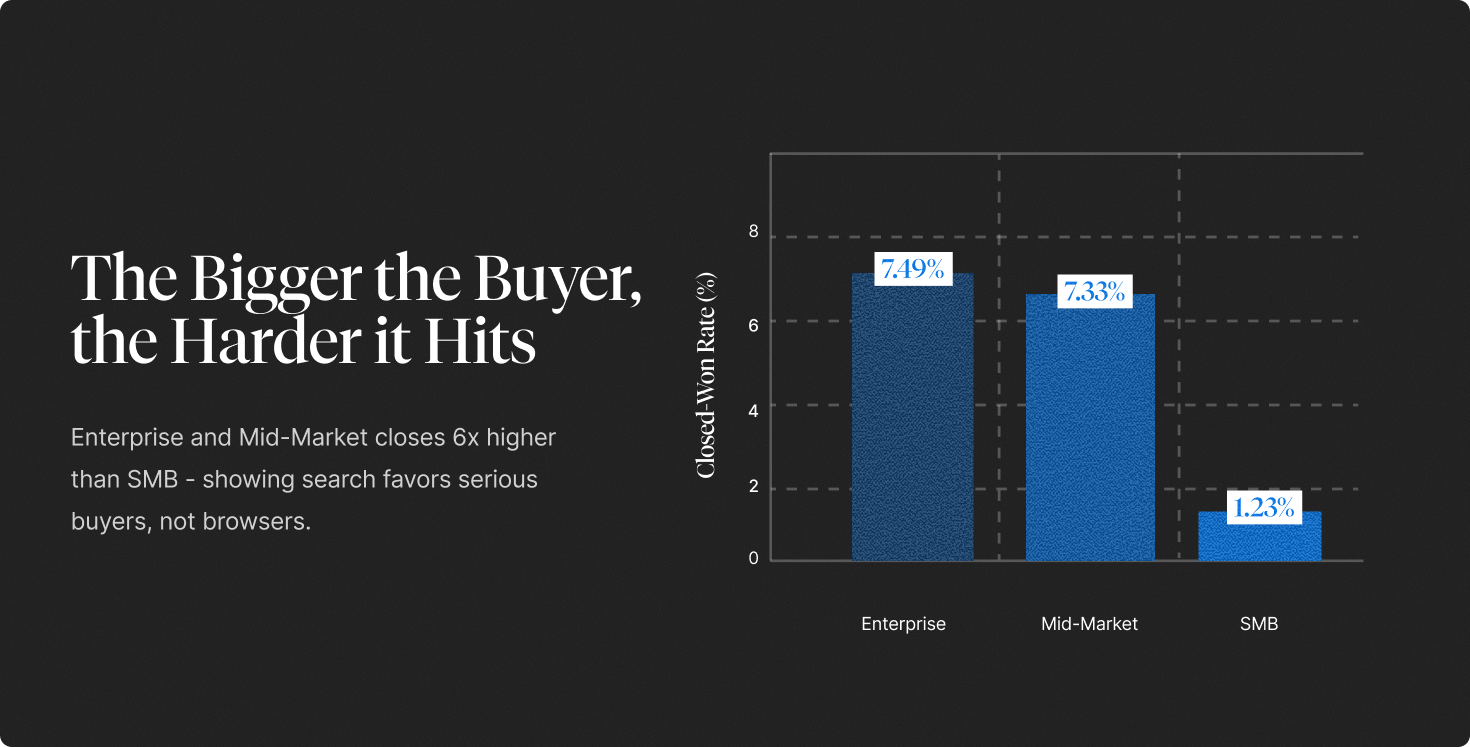
SMB tells almost the opposite story. Qualification starts the year under 3%, climbs steadily to the 8–10% range mid-year, and by late Q3 reaches 11–12% — the highest qualification efficiency of any segment. Yet Closed-Won rates remain stuck around 1.2%, making SMB the least efficient revenue segment despite dramatic gains in intent.
Compared to other channels, SMB behaved unpredictably almost everywhere except Google. Syndication produces steady but low-quality volume, and Facebook’s funnel falls apart before late-stage evaluation. Google ends up doing the heavy lifting by capturing intent, but the post-click experience limits the potential return.
Mid-Market: The Quiet Winner of 2025
While Enterprise cools and SMB accelerates unevenly, Mid-Market quietly becomes the most efficient Google Ads segment overall. With a 7.3% Created → Closed-Won rate (nearly identical to Enterprise) Mid-Market delivers the strongest combination of intent, agility, and buying readiness.
Mid-Market buyers behave like smaller, faster-moving versions of Enterprise accounts. They search frequently, evaluate quickly, and involve fewer stakeholders, which means search has more influence over the full journey. Unlike SMB, MM teams have enough structure to follow through on demand. Unlike ENT, they don’t slow down mid-year. And unlike social channels, where MM performance is highly variable, Google delivers consistent qualification and closing throughout the year.
The more we analyze it, the clearer it becomes that Mid-Market is the “ideal search customer” in 2025: large enough to close reliably, nimble enough to move quickly, and intent-driven enough to rely on Google more than any other channel.
The Takeaway: Enterprise Starts Strong, but Mid-Market emerges as the most consistent
Looking across all three segments, a few themes emerge. Enterprise depends heavily on Q1 and becomes more cautious later, yet still closes reliably when deals survive qualification. SMB becomes dramatically more efficient in qualification as the year progresses, but internal friction prevents that interest from turning into revenue. Mid-Market holds a steady line throughout the year, balancing intent, readiness, and conversion better than either extreme.
Competitor channels don’t share this balance. LinkedIn over-indexes toward Enterprise and Mid-Market but almost entirely misses SMB. Syndication is unpredictable for ENT/MM but oddly stable — though low quality — for SMB. Facebook and Instagram lean heavily toward SMB but rarely materialize as revenue.
Google Ads is the only channel that performs meaningfully across all three segments, adapting to their different behaviors rather than favoring one over the others.
This is the segment story of 2025: Enterprise starts strong, SMB accelerates late, Mid-Market emerges as the most consistent — and Google Ads is the only channel that shows steady value across all of them.
Part IV: The Incremental Impact of B2B’s Most Predictable Growth Engine
Google Ads is often treated as the “default” paid channel in B2B. It’s where marketers go for dependable pipeline, fast answers, and clean intent. But when you strip away attribution bias and evaluate incrementality, a sharper story emerges: Google is not the loudest channel, but it is the most consistently additive one in the entire mix.
Across segments, Google quietly moves deals forward with repeatable lift and minimal volatility. That reliability becomes especially valuable in long, multi-stakeholder B2B cycles where marketers need channels they can trust quarter after quarter.
What Is Incrementality/Lift?
Lift analysis evaluates how deals behave with vs. without a channel present.
While attribution asks: “Was this channel in the journey?”, incrementality asks: “Did this channel make the deal more likely to move forward or close?”
For example:
- If deals with Google Ads in the journey close at 9%,
- And deals without Google Ads close at 3%,
Then Google’s incremental lift is: 9% ÷ 3% = 3×. This means deals exposed to Google Ads were 3× more likely to close.
This distinction is what makes incrementality a truer indicator of a channel’s real business value, and why here at HockeyStack we always encourage both attribution and incrementality to be analyzed hand-in-hand.
Negative lift occurs when deals exposed to a channel convert worse than deals that were never exposed to it. This can happen when a channel primarily generates low-intent leads or attracts the wrong ICP. Most channels have a wide range of lift values — far above zero (great months) and far below zero (bad months).
Google’s Lift Profile: A High Floor, Stable Middle, Manageable Ceiling
When you compare Google to social, syndication, partnerships, or programmatic, a clear pattern emerges: Google has the highest floor and the smallest swings.
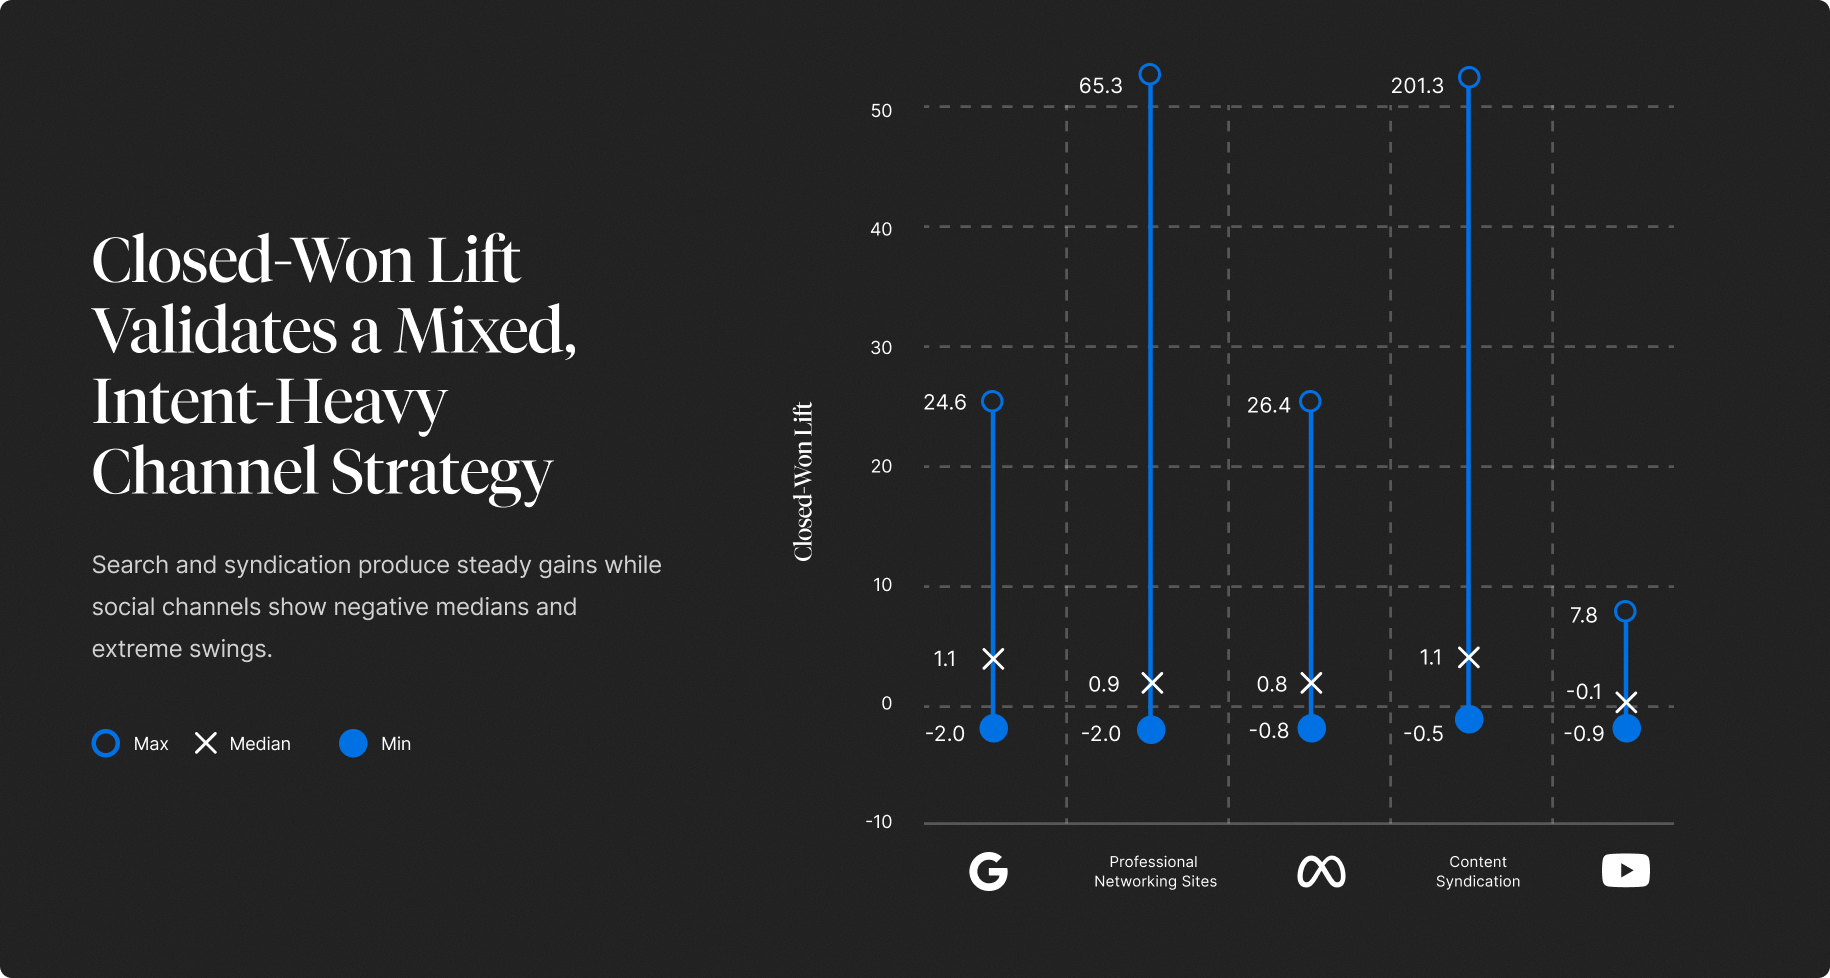
- Minimum lift values hover around –0.7 to –0.8, among the least negative of any paid channel.
- Maximum lift ranges from 9× to ~25×, not extreme, but far more repeatable than the 50×–200× outliers seen elsewhere.
- Mean and median values sit close together, signaling consistency over volatility.
This stability makes Google the closest thing to a “pipeline compounding engine” in paid marketing: it rarely spikes, rarely tanks, and steadily increases conversion likelihood across most accounts.
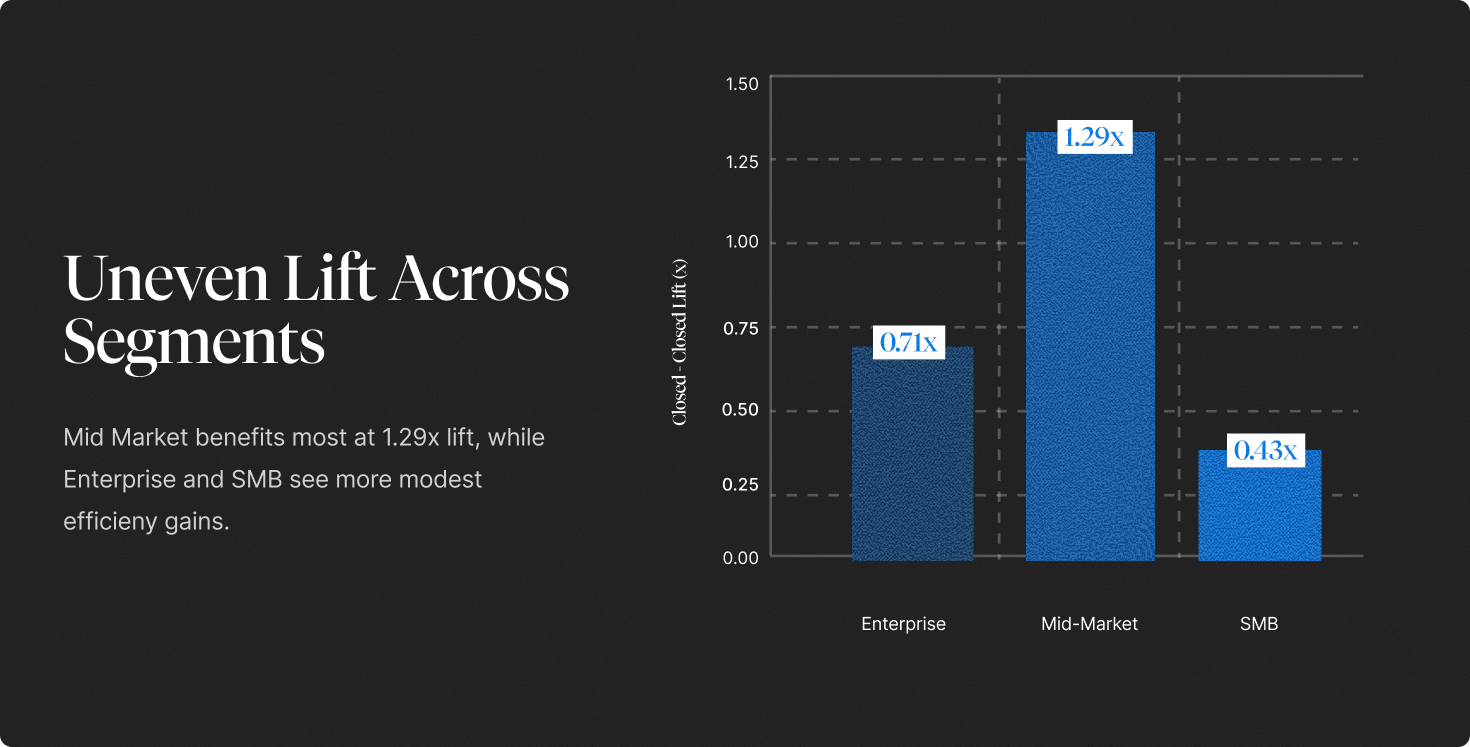
Mid-Market: Google’s Strongest Incremental Gains
Among all company sizes, mid-market sees the most pronounced incremental lift, with closed-won likelihood nearly tripling. Mid-market buyers behave like classic high-intent searchers:
- They research heavily before engaging sales
- They compare categories and competitors
- They’re often already in an active evaluation cycle
Google meets them exactly where they are — not generating demand, but accelerating it. This is where the channel becomes an efficiency engine, not just an acquisition tool.
Enterprise: Modest Early Lift, Higher Late-Stage Influence
Enterprise buyers don’t typically begin their journey in search. They show up through outbound, events, networking, and partner channels.
But the lift appears later:
- vendor shortlist validation
- compliance checks
- competitive research
- pricing verification
Google becomes the “trust but verify” step for buying committees. The incremental lift here is real, but concentrated closer to the point of conversion — which is why enterprise medians are modest, even as top-end lift remains meaningful.
SMB: Google Is Supportive — But Not the Primary Driver
SMB motion favors emotion, speed, and creative-led discovery. This is why Meta dramatically outperforms Google for SMB lift.
Google still contributes positive incremental impact, but its role is more supportive:
- It captures late-stage searchers
- It legitimizes vendors during price or feature comparison
- It reinforces brand familiarity sparked elsewhere
In SMB, Google is the helper, not the hero.
Google’s Stability Matters More Than Its Ceiling
B2B marketers aren’t just managing channels — they’re managing risk. And this is where Google stands apart.
Compared with channels where lift swings wildly and performance depends heavily on creative and targeting precision, Google behaves like a stabilizer. It’s the channel you can lean on when volatility rises elsewhere — the one that reliably adds lift even when budgets tighten or experimental channels wobble.
This is also why Google spend spikes during pressure quarters (Q4 in several benchmark datasets): marketers gravitate toward the most predictable lever in the stack.
Conclusion
Across 3 full quarters of data, one insight is unmistakable: Google Ads is the most consistently reliable paid engine in B2B. While social, syndication, and video channels all play valuable roles, they behave like inputs — variable, creative-dependent, and often unpredictable. Google behaves like infrastructure.
It stands out as a channel that combines meaningful scale with stable funnel efficiency, showing up across Enterprise, Mid-Market, and SMB segments, and delivering incremental lift without the volatility seen in other paid sources.
What to Do With This Report: Actionable Takeaways for B2B Teams
Across 198 companies and 10 months of data, one message is clear: Google Ads behaves differently from every other paid channel. It’s not simply higher intent — it’s structurally more stable, more incremental, and more efficient across segments. Here’s how teams can adapt their paid strategy based on the findings above.
Treat Google as the Foundation, Not the Experiment: Google is the only paid channel that delivers both scale and funnel efficiency, and shows consistent performance across Enterprise, Mid-Market, and SMB with the highest incremental impact “floor”. This makes Google your baseline, not your test channel.
Action: Guarantee a foundational level of Google budget every quarter — even when experimenting elsewhere — because it anchors pipeline predictability.
Align Google Spend to Segment Dynamics: Google works across Enterprise, Mid-Market, and SMB, but each segment interacts with search differently. Enterprise uses it for validation, Mid-Market relies on it during evaluation, and SMB uses it as a follow-through channel.
Action: Adjust your Google strategy by segment: invest more in Enterprise during Q1, maintain steady Mid-Market coverage year-round, and support SMB with frictionless post-click experiences.
Pair Google With Channels That Complement Its Strengths: Google validates and accelerates demand, but social, video, and syndication create it. The most efficient paid engines pair intent capture (Google) with intent creation (LinkedIn, Meta, YouTube).
Action: Build multi-touch sequences where social introduces the brand, YouTube shapes narrative, and Google captures and validates intent at the moment of evaluation.
Use Incrementality to Guide Budget Decisions, Not Attribution Alone: Attribution tells you where a channel appears. Incrementality tells you whether it actually changed outcomes. Google has the smallest negative swings and the most stable incremental lift of any paid channel.
Action: Prioritize channels with consistently positive lift — especially Google — and deprioritize channels that show high volatility or negative incremental impact.
Optimize the Post-Click Experience More Than the Creative: Google traffic is already intent-rich. The largest performance variance comes from landing page clarity, speed, and differentiation, not only ad copy variations.
Action: Prioritize landing page optimization (speed, clarity, pricing transparency, value props) to convert the intent Google already brings.
Protect and Invest in Branded Search — It’s Not Redundant: Branded search consistently shows up in Closed-Won paths because buyers use it for validation, pricing comparisons, and competitor cross-checks. Cutting branded spend often reduces win rates more than traffic.
Action: Maintain strong branded search coverage to capture evaluation-stage intent and reinforce trust at the most critical decision points.
Social may spark interest.
Syndication may fill the top of the funnel.
YouTube may shape narratives.
Google, however, is still where buyers go when they’re evaluating, comparing, and deciding.
This benchmark reflects the broader market. If you’d like to see how your own funnel compares, or where you may be leaving incremental revenue on the table, we’d be happy to walk you through the analysis and show you what it looks like for your own business.