The End of Dashboards: How We Got Here
Ask a CMO about their tech stack.
You’ll hear a laundry list of tools, each offering more data than the last:
Marketing automation. Website tracking. Lead enrichment. Attribution. Outbound orchestration.
LinkedIn shows impressions. Google sends brand lift reports. Salesforce tracks funnel stages.
Call recordings. Site behavior. IP data. Enrichment vendors.
It’s endless.
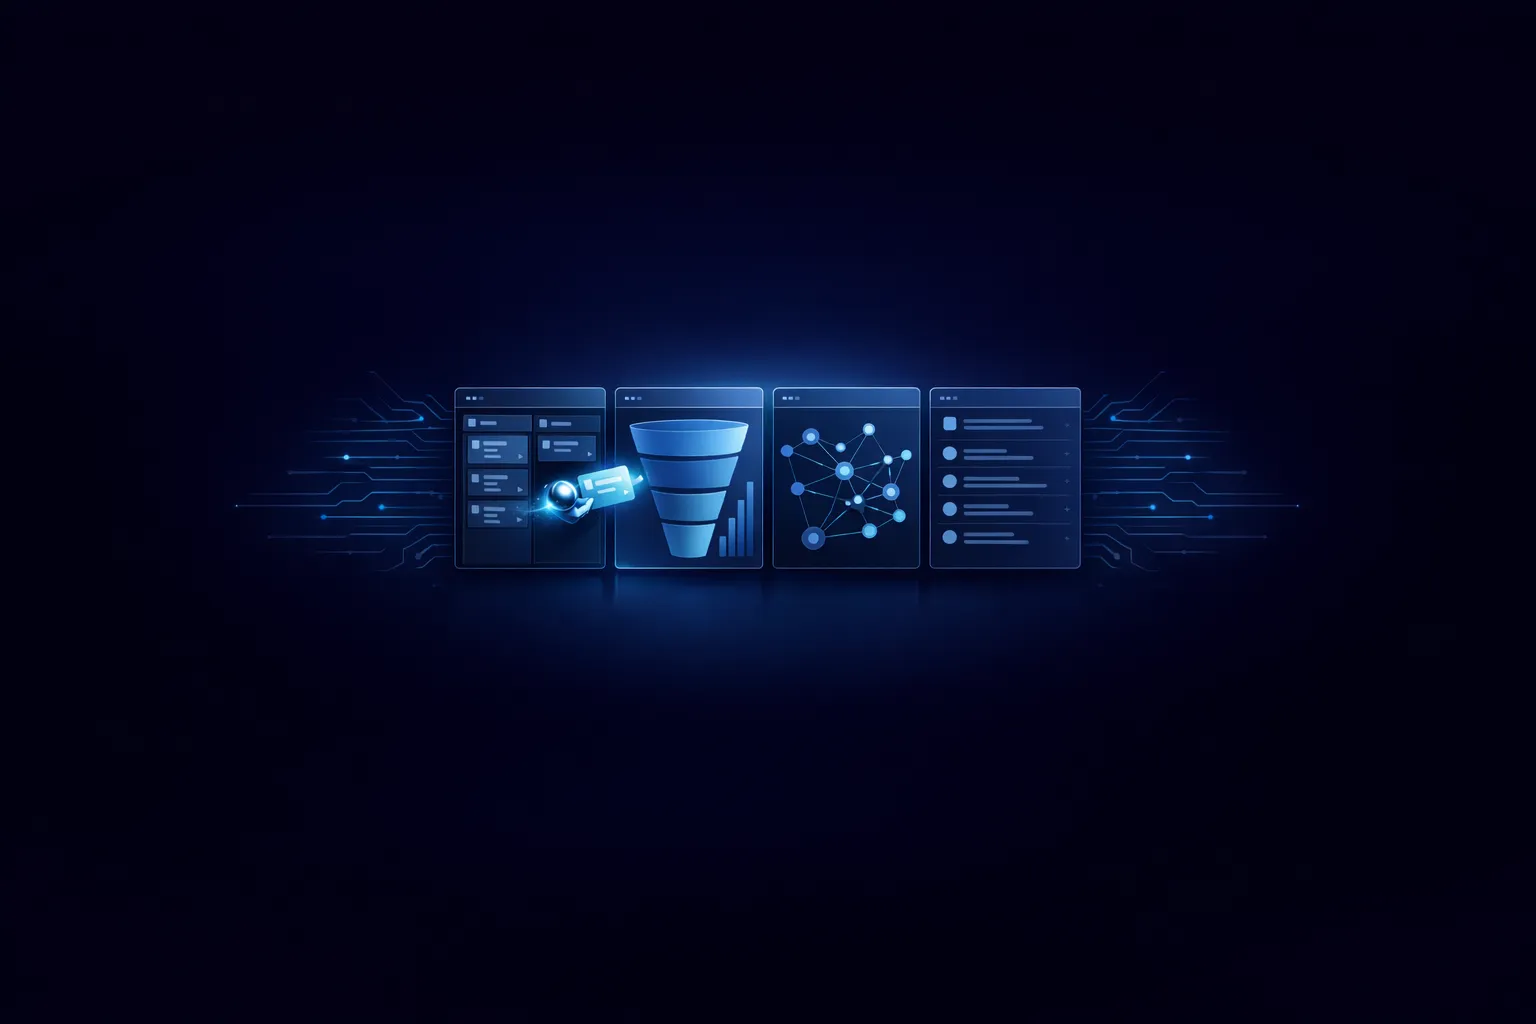
Data is everywhere — but the clarity of what to do with it lives nowhere.
The stack keeps growing. The noise keeps compounding. And yet, the one question remains unanswered:
“What now?”
The Illusion of Insight
Back in the 50s, data-driven marketers desperate for answers used Marketing Mix Modeling — an in-depth statistical analysis of how marketing activities correlated with revenue long-term. These were slow, expensive, rear-view mirrors that showed us what had already gone wrong.
Then came the era of Tableau. Marketers used dashboards built by data teams, and remained shackled to those reports until resources were available for another custom build. Still, the result was beautiful, customized dashboards that unlocked powerful insights — as long as you had a full-time analyst and six weeks to spare.
In 2012, while the world braced for doomsday, Bizible quietly redefined B2B attribution. Built simply on CRM objects like Leads and Opportunities, it gave marketers a clear, accessible way to measure impact across long, complex sales cycles.
But Bizible — the CRM-era pioneer, twice acquired and slowly outpaced — couldn’t keep up with the modern buyer. As buyer journeys fragmented across more channels, touchpoints, and contacts, that rigidity became a dealbreaker.
Every generation of tools gave us a little more data.
But also — more complexity, more delay, and more abstraction.
Marketers stopped spending time driving growth — they were spending time trying to prove it.
By the late 2010s, most marketing teams were running two or three analytics tools in parallel. Tableau for deep dives. Bizible for attribution. Spreadsheets to reconcile the two. We got better and better at visualizing the confusion.
HockeyStack Era
When HockeyStack was founded in 2021, we took a hard look at the problem and and found a common thread:
Every platform — Tableau, Bizible, even GA — relied on object-based models. Everything was built around leads, contacts, and opportunities. And the modern customer journey just didn’t fit in neat little CRM schemas.
Today’s GTM motion spans anonymous and identified contacts, dozens of channels, and hundreds of touchpoints. The journey is nonlinear, unpredictable, and deeply fragmented.
So we made a bet:
We framed every interaction — from every possible source — as a timestamped action.
A flexible data model, built for today’s GTM teams, no data team required. We spent three years building that foundation — without a single customer. We knew if we got the core right, we could solve problems for every team touching the customer journey — not just marketers.
HockeyStack became the only platform with Tableau-level flexibility and Bizible-level usability — minus the tradeoffs.
No-code builder. Cookieless tracking. Funnels that make sense. Lift analysis that doesn’t need a PhD. All in one place. All in real time.
Today, teams at Outreach, Tipalti, RingCentral, 8x8, and more rely on HockeyStack. We became one of the fastest-growing players in the space.
It felt like the finish line was in sight.
It wasn’t.
From Clarity to Chaos
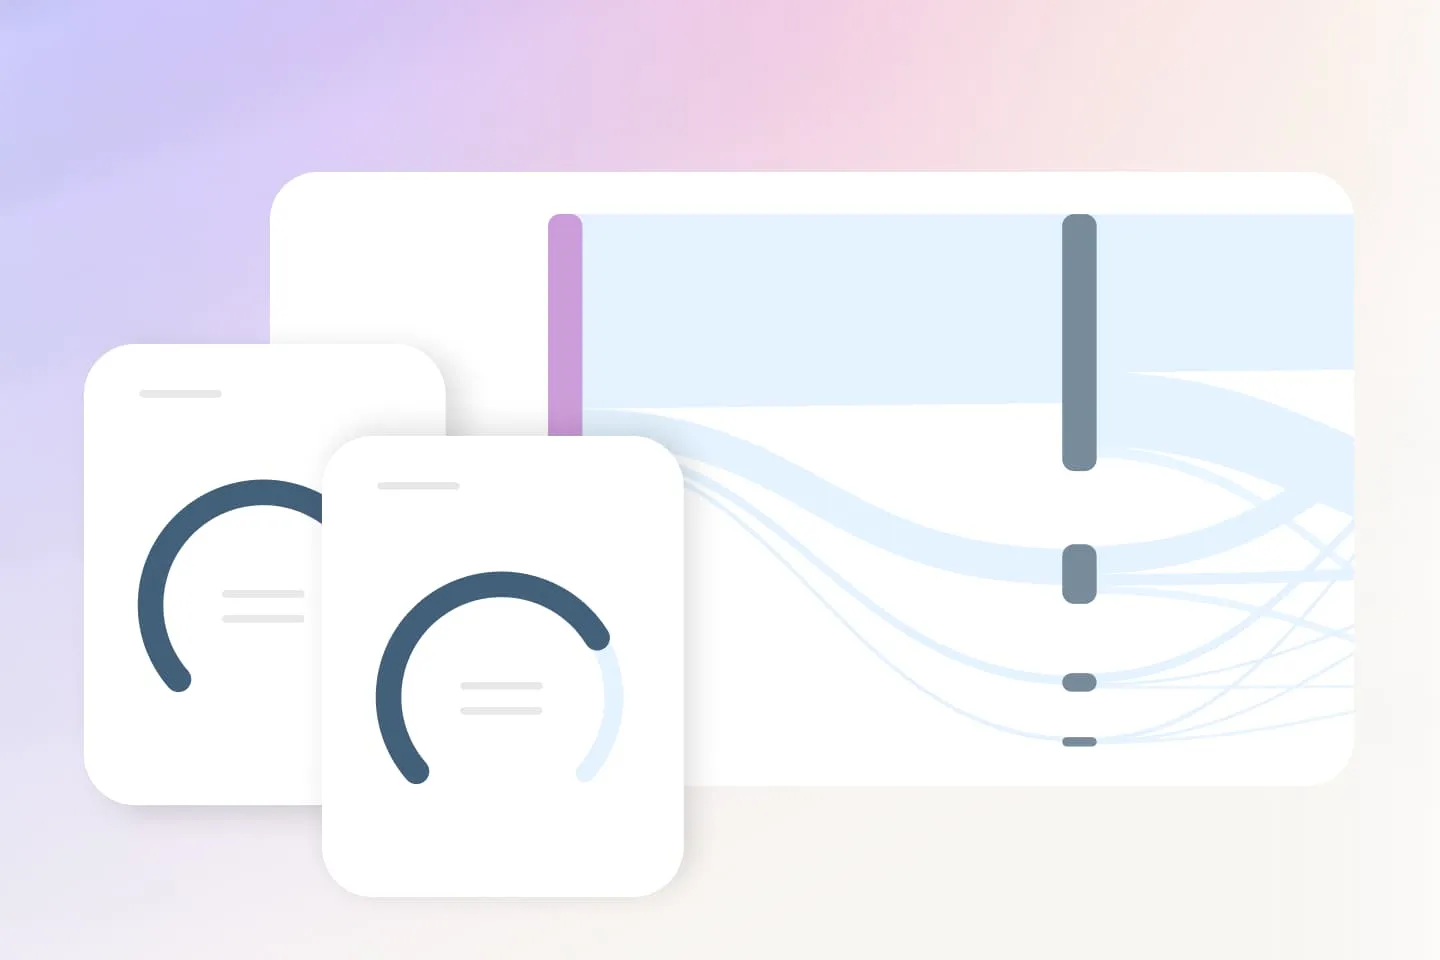
We built the clearest view of the customer journey ever created. A platform that unified data across every stage of the funnel, every touchpoint, and every team — all in real time. No more brittle schemas. No more delayed answers. For the first time, marketing, sales, and revops had a shared reality.
But teams weren’t moving faster. Decisions weren’t getting easier. The insights were there — beautifully rendered, instantly available, context-rich — but they didn’t always lead to action. Somewhere along the way, we had shifted the problem rather than solving it.
We had traded data silos for dashboard sprawl.
The bottleneck wasn’t a lack of data or insight. It was paralysis — too many signals, too few decisions. And in trying to be the solution, we became part of the noise.
Dashboards don’t move pipelines. Charts don’t execute campaigns. Visualizations don’t drive alignment.
What Comes Next
The next era of go-to-market isn’t about showing more data, faster.
It’s about collapsing the distance between insight and execution.
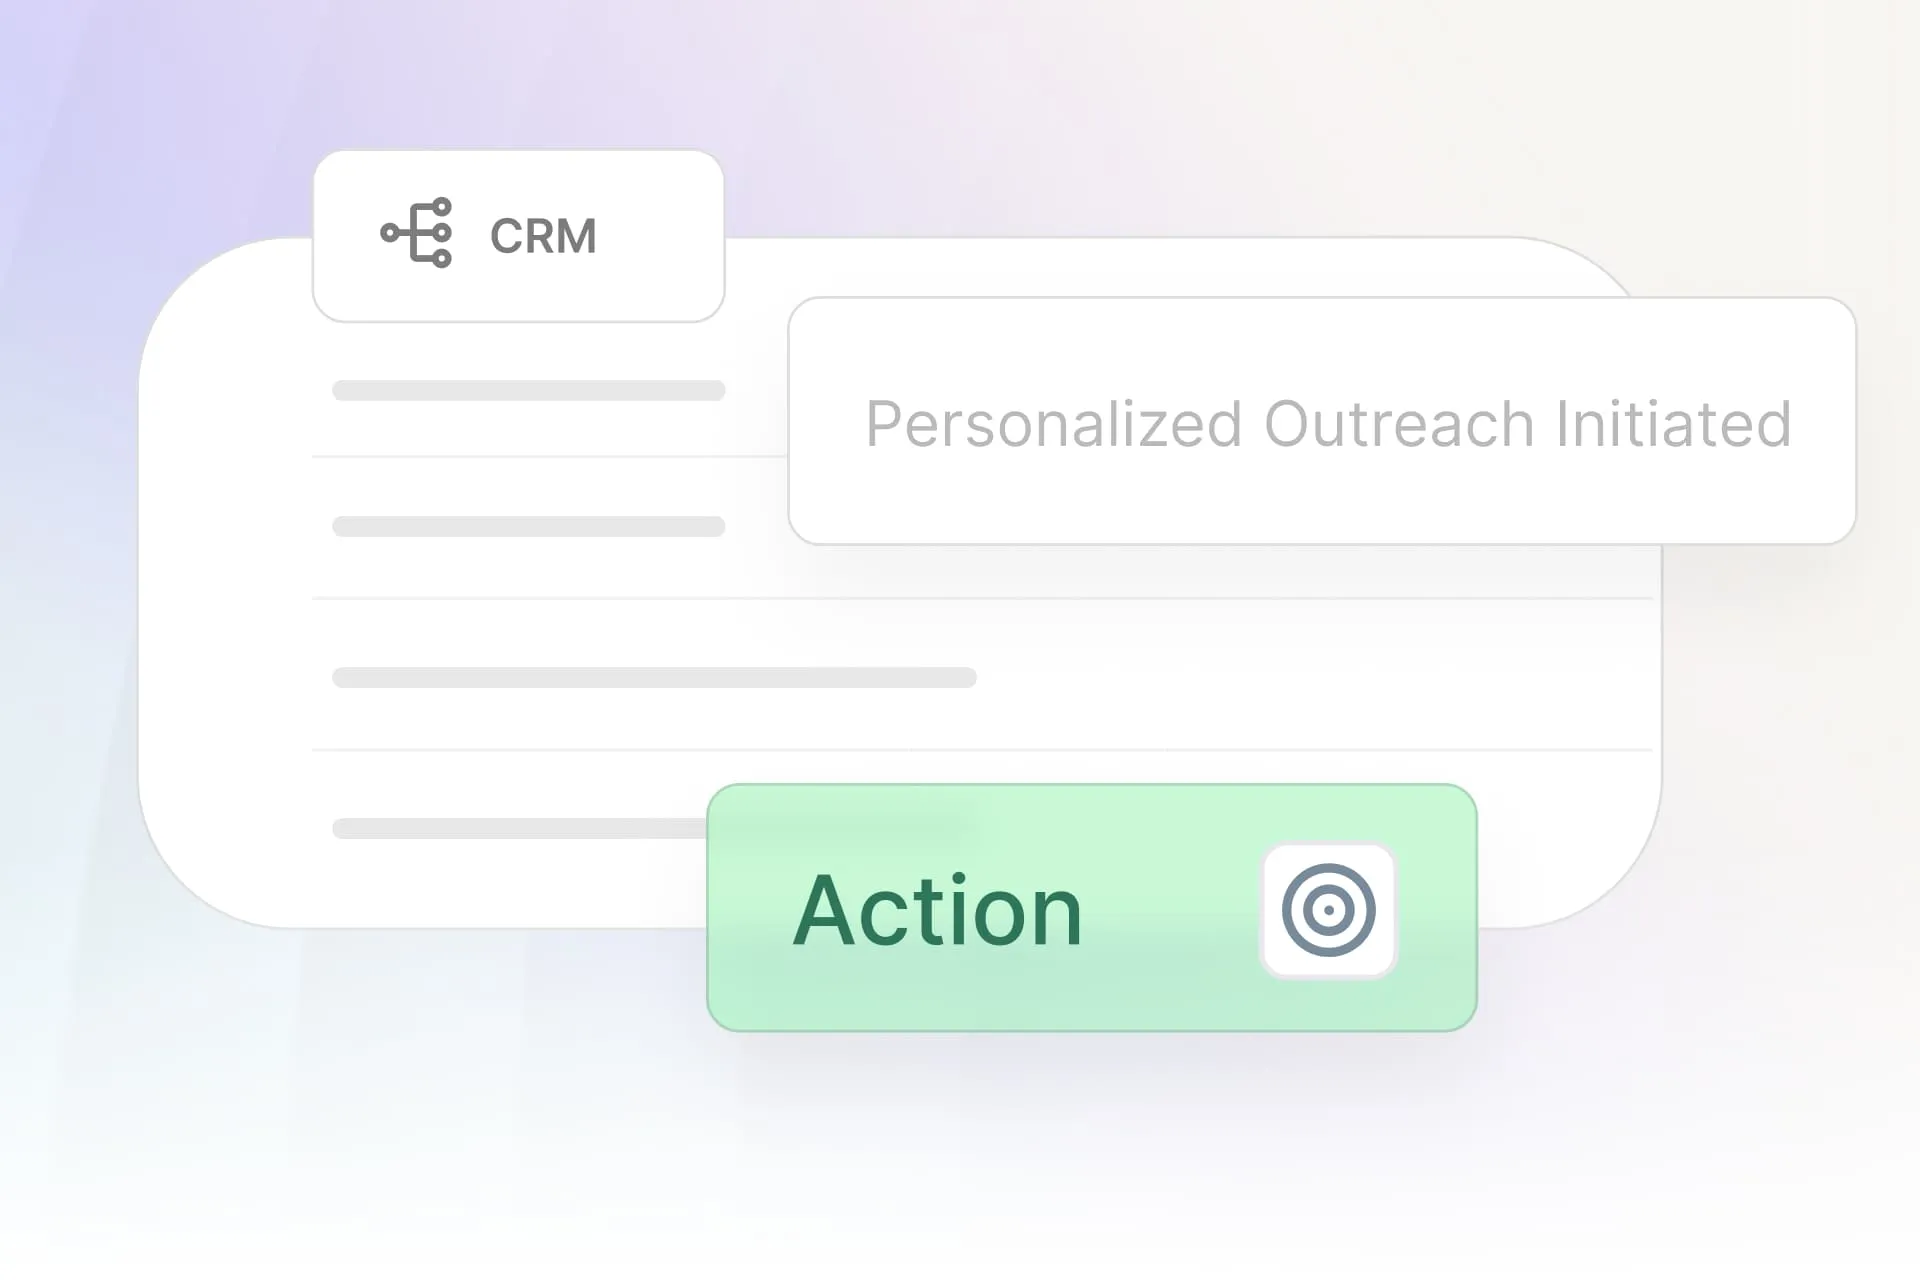
Imagine asking a question — and getting not just an answer, but a recommended action.
Imagine actioning pipeline insights immediately with workflows.
Imagine a world where your team isn't jumping between tools, exporting slides, or translating findings — because the path forward is built right into the product.
This isn’t a new analytics tool.
It’s the end of analytics as we know it.
In part 2, we’ll show you what that looks like — and how it’s already changing the way GTM teams operate.