Types of Marketing Analytics and How They Affect Marketing Strategies

Let's be honest, B2B marketing analytics sounds about as exciting as watching paint dry. It often brings to mind endless spreadsheets and charts that make your eyes glaze over. But what if we told you that mastering marketing analytics is the closest thing your go-to-market (GTM) team has to a crystal ball?
It’s the key to turning disconnected data points into a clear revenue strategy. And here’s the paradox every B2B team is facing: while 77% of companies report having more access to useful data than ever before, nearly half admit they aren't effective at using those insights to guide strategy. [*]
And this isn't just a feeling – it's a major operational bottleneck. In fact, 54% of companies say their biggest challenge to data-driven marketing is a lack of data quality and completeness. It's no surprise, then, that a staggering 87% of marketers consider data their organization’s most underutilized asset. [*]
In this guide, we’ll break down the different types of marketing analytics and show you how to use each one to sharpen your strategy. The goal is simple: stop just collecting data and learn how to use it to make informed decisions and drive real growth.
The 4 Types of Marketing Analytics (And What They Actually Mean for Your GTM Strategy)
Let's cut through the jargon. You don't need a data science degree from MIT to understand B2B marketing analytics. In fact, for years, this field was dominated by three main types: descriptive, predictive, and prescriptive.
But that's an outdated model.
The modern GTM team needs to answer four distinct questions, which gives us four types of analytics. Think of it as a ladder. Most companies are stuck on the first rung, but the real money is made at the top.
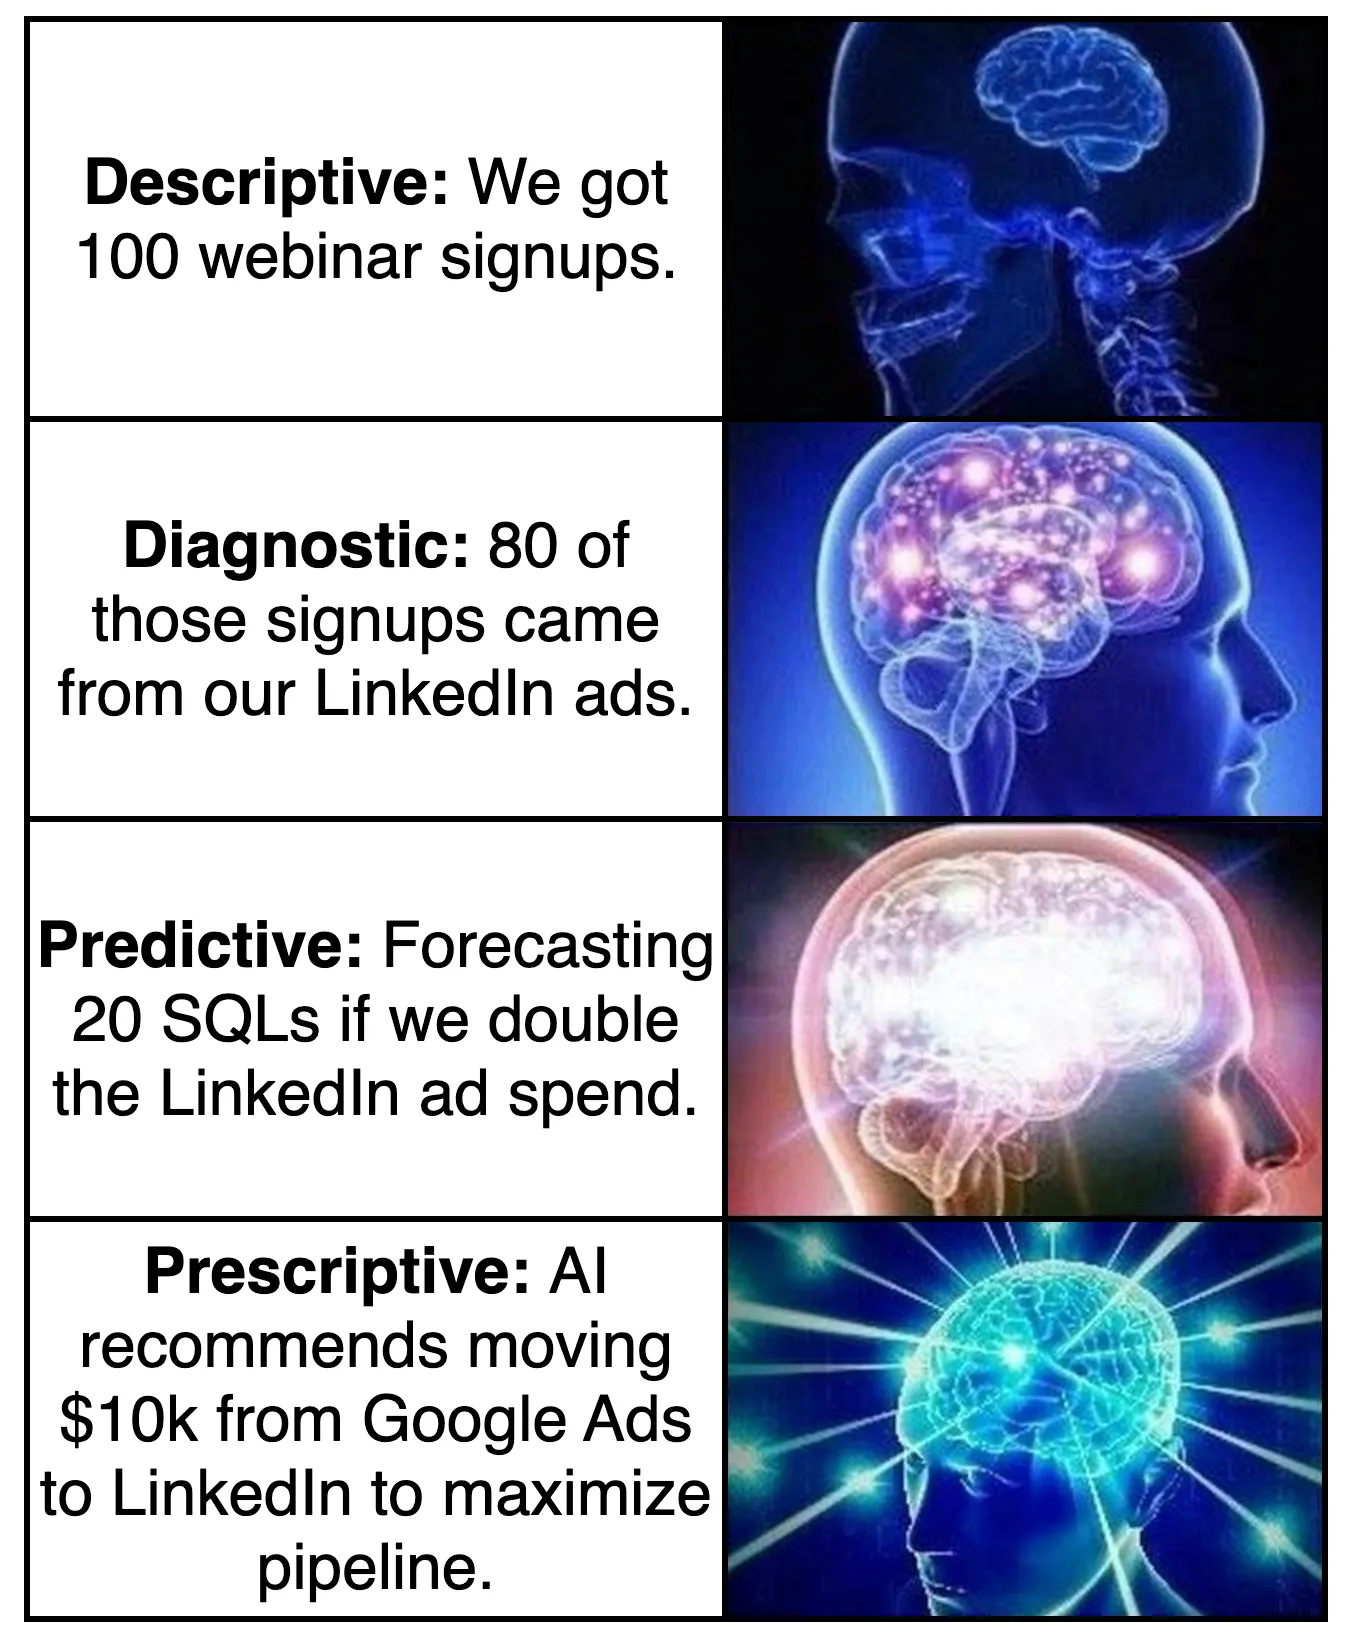
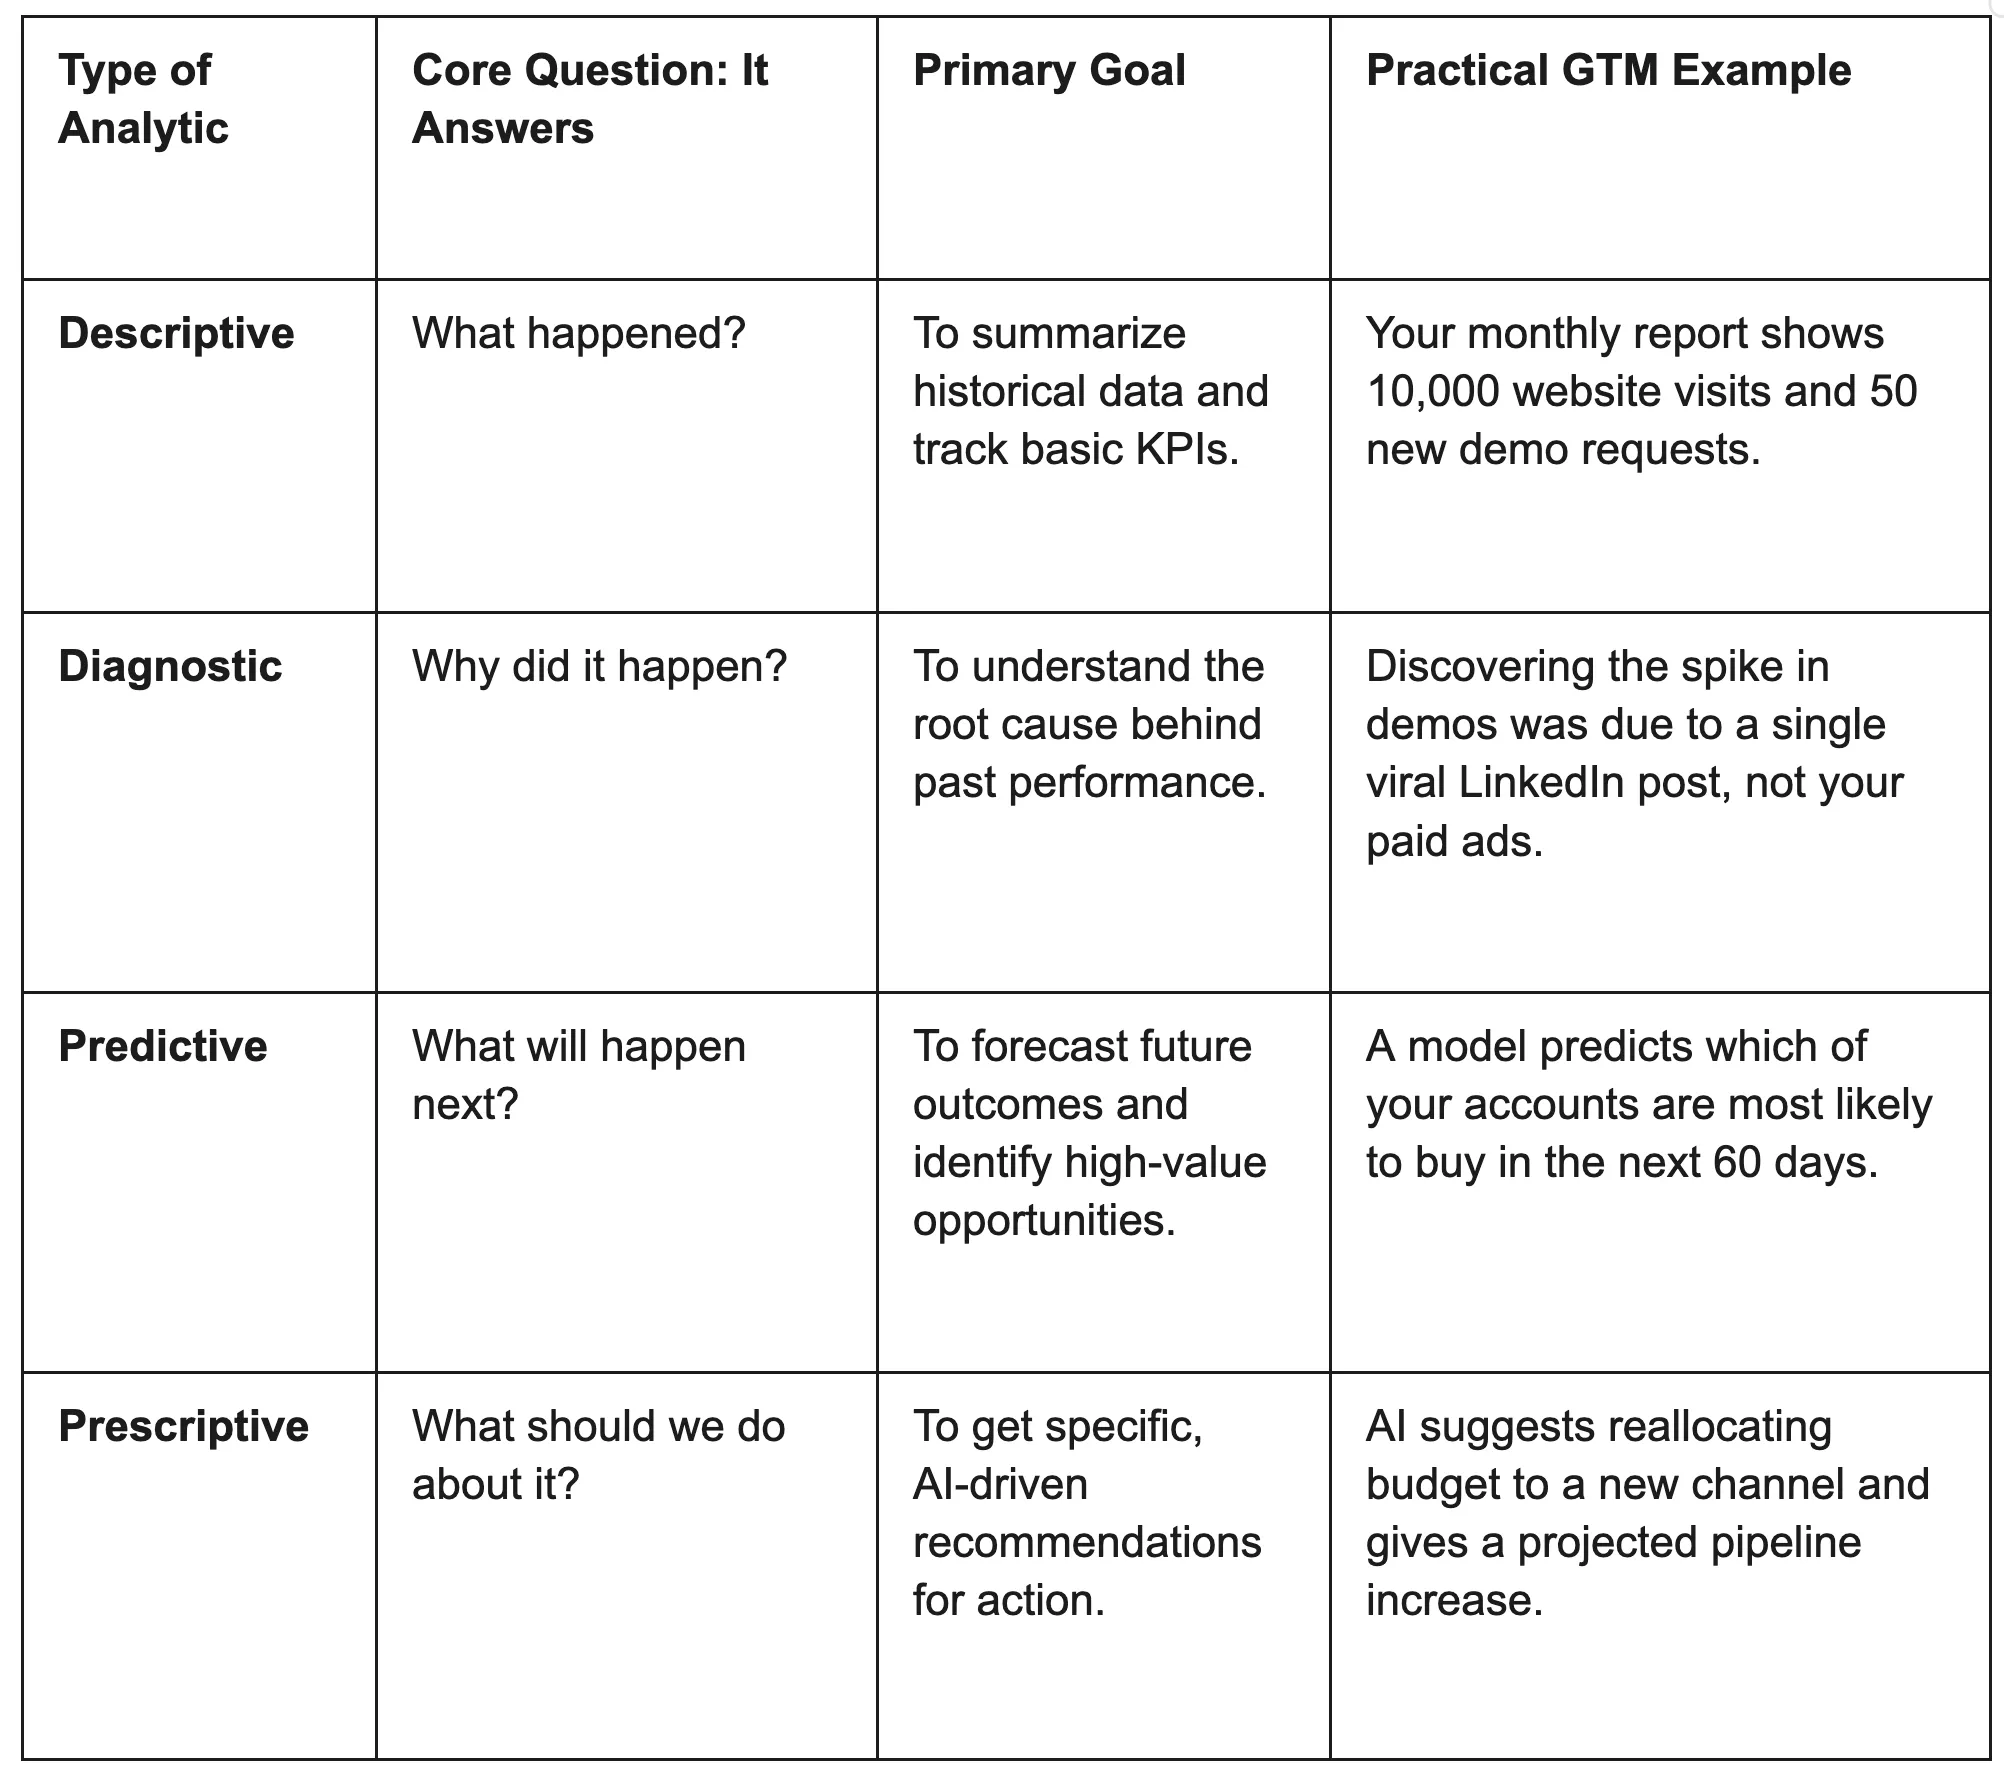
- Descriptive: What happened?
- Diagnostic: Why did it happen?
- Predictive: What is likely to happen next?
- Prescriptive: What should we do about it?
Understanding how to use all four is the difference between reporting on the past and actively shaping your future revenue.
Let's break them down with examples.
Descriptive Analytics (What Happened)
This is the most basic form of analytics, the one you see in every standard dashboard. It takes your historical data—from social media, your website, and other digital marketing channels—and tells you, in simple terms, what happened over a specific period.
- What it looks like in practice:
- Your Google Analytics dashboard showing you had 20,000 website visitors last month.
- A HubSpot report telling you your email campaign had a 25% open rate. Your CRM showing you generated 50 MQLs from your latest webinar.
- The honest truth: Descriptive analytics is essential—it's your scorecard. But it's also where most companies stop. It gives you surface-level facts without the crucial context behind them, making it dangerously easy to draw the wrong conclusions. It's like knowing the final score of a game without watching any of it.
When it's useful:
- You need a baseline: It provides the fundamental metrics you need for day-to-day reporting to track progress against basic goals.
- You're spotting anomalies: A sudden, massive drop in website traffic? A spike in email unsubscribes? Descriptive analytics is your smoke alarm; it tells you that there's a fire, but not what caused it.
Where it falls short:
- It's all rearview mirror: It only tells you about the past and provides no guidance for the future.
- It lacks context: Knowing you got 20,000 visitors is useless. What does their user behavior look like? What are their demographics? Did they engage with high-intent pages? Descriptive analytics alone can't tell you.
Diagnostic Analytics (Why Did It Happen)
This is the next step up the ladder and where real analysis begins. Diagnostic analytics dives into your historical data to understand the root causes behind the performance you're seeing.
- What it looks like in practice:
- You saw MQLs from the webinar. You dig deeper and find that 80% of them came from a single LinkedIn post you shared, while your expensive email marketing campaign contributed almost none.
- You notice your bounce rate is high, hurting your conversion rates, and discover it's because your landing page load speed is abysmal on mobile devices.
- The honest truth: This is where you start connecting the dots. It's the investigative work that separates a junior marketer from a strategist. However, doing this manually is a nightmare. It requires stitching together data from different sources and hours of slicing and dicing in spreadsheets—which is why most teams simply don't have time for it.
When it's useful:
- You need to understand marketing performance: It helps you explain why a campaign was a huge success or a total flop, allowing you to double down on what works and kill what doesn't.
- You're optimizing your funnel: By understanding why users drop off at certain stages, you get an in-depth look at the customer experience and can identify and fix leaks in your funnel.
Where it falls short:
- It's still focused on the past: While it explains past events, it doesn't build a model to forecast the future.
- It can be incredibly time-consuming: Without a unified analytics platform that connects all your data (like HockeyStack's Odin AI, for example), this process is manual, painful, and often gets skipped.
Predictive Analytics (What's Likely to Happen Next)
Now we're getting into the exciting stuff. Predictive analytics uses historical data, statistical models and algorithms, and machine learning to identify the likelihood of future outcomes. It's about moving from reacting to the past to anticipating the future.
- What it looks like in practice:
- A lead scoring model that predicts which accounts are most likely to close this quarter based on firmographics and intent signals.
- A forecast that shows you're on track to miss your pipeline goal in two months if you don't change your current strategy.
- Identifying which customers are at the highest risk of churning in the next 90 days.
- The honest truth: This is where you start to feel like you have superpowers. It allows you to focus your resources—your time, your team, your budget—on the opportunities with the highest probability of paying off. The catch? It's complex and requires clean, connected data to be accurate. Garbage in, garbage out.
When it's useful:
- You need to prioritize effectively: It tells your sales team which accounts to chase and your marketing team which leads to nurture.
- You want to forecast with confidence: It provides a data-driven look into your future pipeline and revenue, moving beyond simple guesswork.
Where it falls short:
- It requires a lot of high-quality data: It's not for companies just starting out. Your prediction models are only as good as the data you feed them.
- It tells you what might happen, not what to do: A model might predict you'll miss your goal, but it won't give you the specific plan to fix it.
Prescriptive Analytics (What Should We Do About It)
This is the top of the ladder—the final frontier. Prescriptive analytics takes the predictions from the previous stage and recommends specific actions you can take to achieve a desired outcome or mitigate a future problem. It doesn't just show you the future; it gives you a playbook to change it.
- What it looks like in practice:
- Your model predicts a pipeline shortfall (predictive). A prescriptive analytics tool then recommends you reallocate $10,000 of your ad budget from your underperforming Google Ads campaign to a high-ROI LinkedIn campaign and provides the projected uplift in pipeline (prescriptive).
- It identifies an account is showing buying intent and automatically suggests a personalized outreach sequence for your sales rep to use.
- The honest truth: This is the promise of AI in GTM. It moves your team from being data analysts to strategic decision-makers. Instead of spending hours figuring out what to do, your team is presented with a set of optimized choices. This is the most complex and powerful form of analytics, and it's what modern AI-powered GTM platforms like HockeyStack are built to deliver.
When it's useful:
- You need to optimize in real-time: It allows you to make rapid, data-backed marketing decisions to improve campaign performance and resource allocation on the fly.
- You want to automate GTM execution: It connects insights directly to actions, like adding a high-intent account to an automated ad campaign or sales sequence.
Where it falls short:
- It's highly complex and requires advanced tools: You can't do this in a spreadsheet. It relies on sophisticated AI models that can process vast amounts of data and run simulations.
- It requires trust in the AI: Adopting prescriptive analytics means trusting the machine's recommendations, which can be a cultural shift for many teams.
Why Bother with Marketing Analytics? (Hint: Your Budget Is Leaking)
Let's get straight to the point. Marketing analytics isn't just a nice-to-have activity for when you have free time. In today's market, flying blind isn't just risky—it's actively burning through your budget.
When you don't have a tight grip on your analytics, you're essentially guessing with company money. And guesses are expensive. How expensive? Poor quality data, like the kind that lives in disconnected systems, can cost businesses an average of 15-25% of their revenue. [*]
So, why is a solid analytics strategy non-negotiable? It's not about creating prettier charts; it's about solving the most expensive problems your GTM team faces.
It Stops You from Setting Your Ad Budget on Fire
Without clear analytics, your marketing budget is full of holes. You're spending money, but you can't definitively say which marketing channels, campaigns, or keywords are actually influencing revenue and which are just costing you money.
- The problem: You know some of your ad spend is wasted, but you don't know which half. A recent study found that B2B marketers estimate up to 45% of their ad spend is wasted on irrelevant accounts. [*]
- How analytics fixes it: By connecting every touchpoint to revenue, analytics shows you exactly what’s working. You can see that while your Google Ads bring in volume, the LinkedIn thought-leadership posts are sourcing your biggest deals, directly impacting profitability. This allows you to stop funding vanity metrics and start doubling down on what actually pads the pipeline.
It Unifies Your Messy, Siloed GTM Data
Your marketing data lives everywhere: your CRM, ad platforms, website analytics, email tool, and a dozen other places. Operating without a unified analytics view is like trying to assemble a puzzle with pieces from five different boxes.
- The problem: The majority of marketers say their reporting breaks down because data is spread across too many disconnected systems. This data silo problem makes it impossible to see the full customer journey.
- How analytics fixes it: A proper marketing analytics platform acts as your single source of truth. It pulls data from all your disparate tools and stitches it together. Suddenly, you can see how a prospect who first saw an ad on LinkedIn, then read three blog posts, and finally attended a webinar turned into a closed-won deal. This holistic view is impossible when your data lives in separate tools.
It Answers the Million-Dollar Question: Is This Working?
Every marketing leader has been in that meeting, trying to justify their budget and prove the value of their team's efforts. Without concrete data connecting marketing activities to revenue, you're left talking about clicks, impressions, and general customer engagement while the CFO is thinking about customer acquisition cost (CAC) and customer lifetime value (LTV).
- The problem: Only 36% of marketers say they can accurately measure ROI across their campaigns, with attribution being a key concern. [*] This inability to prove value puts marketing on the defensive and makes it the first budget to get cut.
- How analytics fixes it: Analytics closes the loop. It moves the conversation from "We got 10,000 likes" to "Our content influenced $500k in the pipeline last quarter." It allows you to track marketing-sourced and marketing-influenced revenue, proving that the GTM engine isn't a cost center—it's the primary driver of growth.
In short, not using marketing analytics isn't a neutral choice. It's a decision to waste money, work with incomplete data, and constantly struggle to prove your team's worth. A modern analytics strategy gives you the clarity to prevent all three.

How to Not Screw Up Your Marketing Analytics: 4 Essential Best Practices
Let's be real: a lot of "best practices" are just common sense dressed up in business jargon. You don't need a guide to tell you to "analyze your data." But you do need a framework for turning that data into something useful—like more pipeline and a bigger budget.
Forget the generic advice. These are the four non-negotiable practices that separate high-growth GTM teams from the ones who are perpetually stuck proving their own existence.
1. Start with Revenue, Not Clicks
The most common mistake in marketing analytics is building a strategy around vanity metrics. Your CEO doesn't care about your click-through rate or the number of likes on a post; they care about revenue, pipeline, and customer acquisition cost (CAC). When the marketing team reports on clicks while the sales team is measured on quota, a fundamental misalignment is created.
This isn't just a communication issue; it has serious financial consequences. Misalignment between sales and marketing can cause companies to leak up to 10% of their annual revenue. [*] It puts marketing on the defensive, constantly having to justify its budget with metrics that don't translate to bottom-line impact.
The fix is to build all your dashboards and reports backward from revenue. Your primary, top-line key performance indicators (KPIs) should be business outcomes, and every other metric should be analyzed based on how it influences them. Focus your team on tracking:
- Marketing-Sourced Pipeline
- Marketing-Influenced Revenue
- Pipeline Velocity
- Customer Acquisition Cost (CAC)
This approach forces you to focus only on activities that actually move the needle financially.
2. Create a Single Source of Truth
For most companies, GTM data is a mess. Your lead data lives in HubSpot, your sales and customer data is in Salesforce, your ad data is in Google and LinkedIn, and your B2B web analytics are in a separate tool. Trying to understand performance from this is like trying to assemble a puzzle using pieces from five different boxes. It’s an impossible task.
This data silo problem is a massive operational bottleneck. A majority of B2B marketers identify incomplete or poor system integration as one of their biggest MarTech challenges. [*] Without a connected view, you can't see the full customer journey, which means you can never be certain which touchpoints are actually driving conversions. Your attribution will always be a guess.
The only way to solve this is to make unifying your data a top priority. Use a platform that acts as a single source of truth, integrating with all your core GTM tools to pull everything into one place. Only then can you track a complete journey—from a prospect's first anonymous website visit to becoming a closed-won deal—and accurately attribute revenue to every touchpoint along the way.
3. Focus on Leading, Not Just Lagging, Indicators
Analytics data falls into two camps. Lagging indicators tell you what already happened (e.g., you generated $1M in revenue last quarter). Leading indicators help you predict what's going to happen (e.g., your number of new demo requests is up 30%). While both are important, high-performing teams are obsessed with leading indicators.
Teams that only focus on lagging indicators are always looking in the rearview mirror. They are constantly reacting to past results instead of proactively shaping future ones. This means they can't spot potential problems—like a dip in pipeline creation—until it's too late to fix it for the current quarter.
To get ahead, you must identify the key leading indicators that reliably predict your lagging revenue goals. Then, build your dashboards and team meetings around them. Common examples for B2B GTM teams include:
- Number of high-intent accounts identified per week
- Percentage of target accounts showing new or increased engagement
- Product-qualified leads (PQLs) or free trial sign-ups
- Pipeline velocity (how fast deals are moving through stages)
By monitoring these predictive metrics, you can make adjustments today to ensure you hit your goals next quarter.
4. Operationalize Your Insights
Finally, having a beautiful dashboard full of brilliant insights is completely worthless if nobody on your team does anything with it. The biggest failure of most analytics strategies is that the data remains trapped in a report. The insights are never operationalized, meaning they don't trigger any action from the sales or marketing teams.
A modern analytics strategy transforms your data from a passive reporting tool into an active engine for growth. This means making your analytics platform the command center for your entire GTM team, where insights automatically connect to workflows.
Instead of just observing data, your team should be acting on it—instantly and automatically. For example:
- When an account from your target list hits a certain engagement score, automatically enroll them in a tailored ad campaign and notify the account owner in Slack or other integrated apps.
- When a prospect visits your pricing page twice in one week, automatically create a high-priority task in the CRM for their sales rep to follow up with a personalized message.
This is how you close the loop between data and action, ensuring that every valuable insight is leveraged to drive revenue.
Moving from Analytics to Action: The Right Tool for the Job
So, how do you actually do all this? How do you unify siloed data, focus on leading indicators, and operationalize your insights without hiring a team of data scientists and engineers?
The honest answer is you can't do it with the old toolkit. Traditional analytics tools like Google Analytics 4 are great for top-of-funnel web traffic, but they can't connect that activity to your CRM. Your CRM reports on deals, but it has zero visibility into the marketing journey that created them. Trying to stitch this all together in spreadsheets is a manual, error-prone nightmare that nobody has time for.
This is why modern go-to-market teams are moving to a new category of tool: AI-powered GTM Platforms. These platforms are built to solve the exact challenges we've outlined by unifying data and embedding intelligence into your workflows.
Enter HockeyStack: Your GTM Command Center
HockeyStack is designed to be the single source of truth that makes these best practices not just possible, but easy.
- It unifies your data automatically: Remember the single source of truth we talked about? HockeyStack does that out of the box. It integrates natively with your entire GTM stack—your CRM (like Salesforce or HubSpot), your ad platforms, your data warehouses, and more—to give you a complete, cross-channel view of the entire customer journey.
- It focuses on what matters—revenue: The platform is built around the key metrics your CEO actually cares about. Instead of just reporting on clicks and leads, HockeyStack's AI analyst, Odin, automatically connects every single marketing activity to pipeline and revenue, so you can finally see the true return on investment (ROI) of your efforts.
- It powers your entire GTM team: HockeyStack moves beyond simple reporting and puts data into action.
- Odin AI doesn't just show you what happened; it tells you why and recommends what to do next, like reallocating budget to higher-performing campaigns.
- The AI rep assistant, Nova, analyzes account activity and provides instant and actionable insights, talking points, and outreach recommendations so your reps can focus on the highest-intent accounts with the perfect messaging.
- You can build automated GTM workflows that trigger actions across your teams based on real-time data, effectively operationalizing your insights without any manual work.
HockeyStack is designed to take you up the analytics maturity ladder—from basic descriptive reporting to AI-driven prescriptive action.
If you're tired of wrestling with spreadsheets and ready to see what a truly unified GTM platform can do, book a demo today or play with our interactive demo now to see our platform in action.
Frequently Asked Questions (FAQs)
What is the difference between data analytics and marketing analytics?
Data analytics is a broad field concerned with the process of examining any kind of data to find trends and draw conclusions. It can be applied to any department in a business, from finance to human resources to operations.
Marketing analytics is a specialized subset of data analytics. It applies data analysis techniques specifically to marketing data. Its sole purpose is to enable data-driven decision-making for marketing initiatives, understand customer behavior, and connect campaign performance directly to business goals like pipeline and revenue.
What's the difference between marketing analytics and business intelligence (BI) platforms?
Think of BI as the final scoreboard for the whole company—it gives a broad, high-level view of past performance across all departments. Marketing analytics is the coach's playbook for your GTM team. It's focused, diagnostic, and prescriptive, telling you not just what happened in your marketing and sales efforts, but why it happened and what you should do next to win.
Why can't I just use Google Analytics and spreadsheets for this?
While that free toolkit is a common starting point, it has critical blind spots. The core issue is that those tools can't connect your marketing efforts to the revenue data sitting in your CRM. This means you will always struggle with:
- Manual work: Hours wasted every week exporting and trying to stitch together messy data.
- Incomplete picture: An inability to see the full customer journey, prove ROI, or properly attribute complex A/B testing results.
- No predictive power: You're stuck looking at the past, with no ability to forecast pipeline or get AI-driven recommendations.
How does a platform like HockeyStack help me track the dark funnel?
The dark funnel is just another name for the customer journey touchpoints you can't currently track—like a prospect listening to a podcast or seeing a LinkedIn post without clicking. A unified marketing analytics tool helps illuminate this by connecting those signals to known accounts. By integrating with more data sources (like call intelligence tools or community platforms), it can attribute influence to activities that were previously invisible, giving you a much more accurate picture of what's really driving demand.
How long does it take to set up HockeyStack and see value from it?
Getting the platform technically set up is fast. You can connect your data sources and have unified dashboards within 24 hours. The strategic value begins almost immediately after. You'll start seeing a complete view of your customer journey right away, and the AI models will begin delivering predictive insights—like identifying high-intent accounts—within the first few weeks as they learn from your historical data.
What are some common use cases for advanced marketing analytics?
Beyond standard reporting, advanced analytics powers strategic decision-making. Common use cases include deep customer segmentation to truly understand your target audience, predicting churn to improve customer retention, and identifying emerging market trends before your competitors do. It allows you to move from reacting to the past to proactively shaping your future strategy.
Is this just another dashboard, or does it trigger actions?
While a unified platform provides much better data visualization than a standard dashboard, its real power lies in connecting insights to action. The goal is to use data to power your marketing automation. For example, when analytics identifies a high-intent account segment, it can automatically trigger a workflow that adds those accounts to a specific ad campaign or alerts your sales team, ensuring no opportunity is missed.