We Built a Production Debugging Agent That Finds the Right Root Cause 92.4% of the Time
Our engineers were spending two days a week on maintenance. Reproducing bugs they'd seen before, writing patches for edge cases they'd already thought about, chasing Sentry alerts through log dashboards at 11pm on a Tuesday.
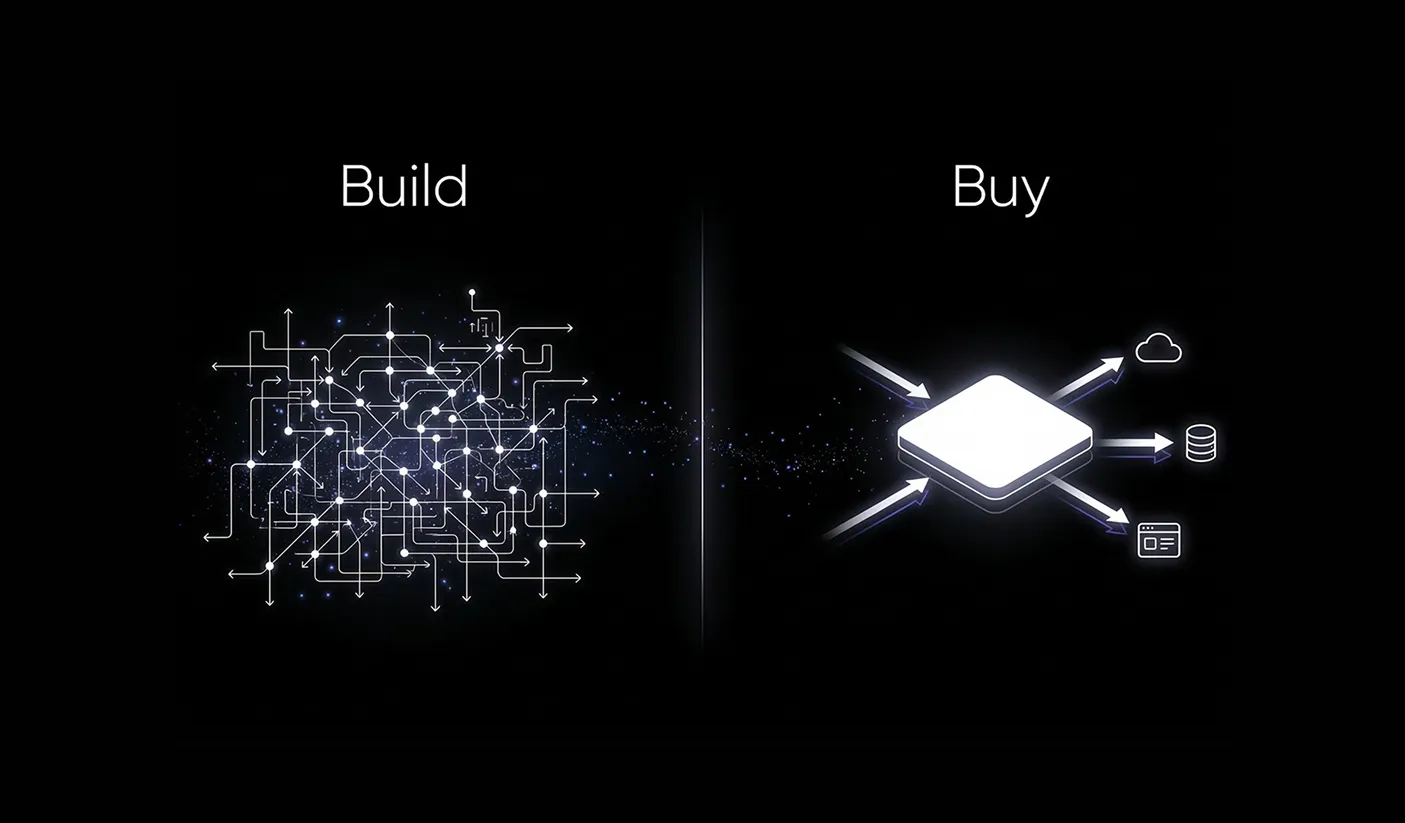
We have about twenty engineers. Two days a week each is eight engineer-days per week of maintenance, more than a full-time engineer dedicated entirely to keeping things running. For a team trying to ship an AI-native sales platform that displaces Salesforce, that's capacity we can't afford to lose. We couldn't hire our way out of it, so we automated it.
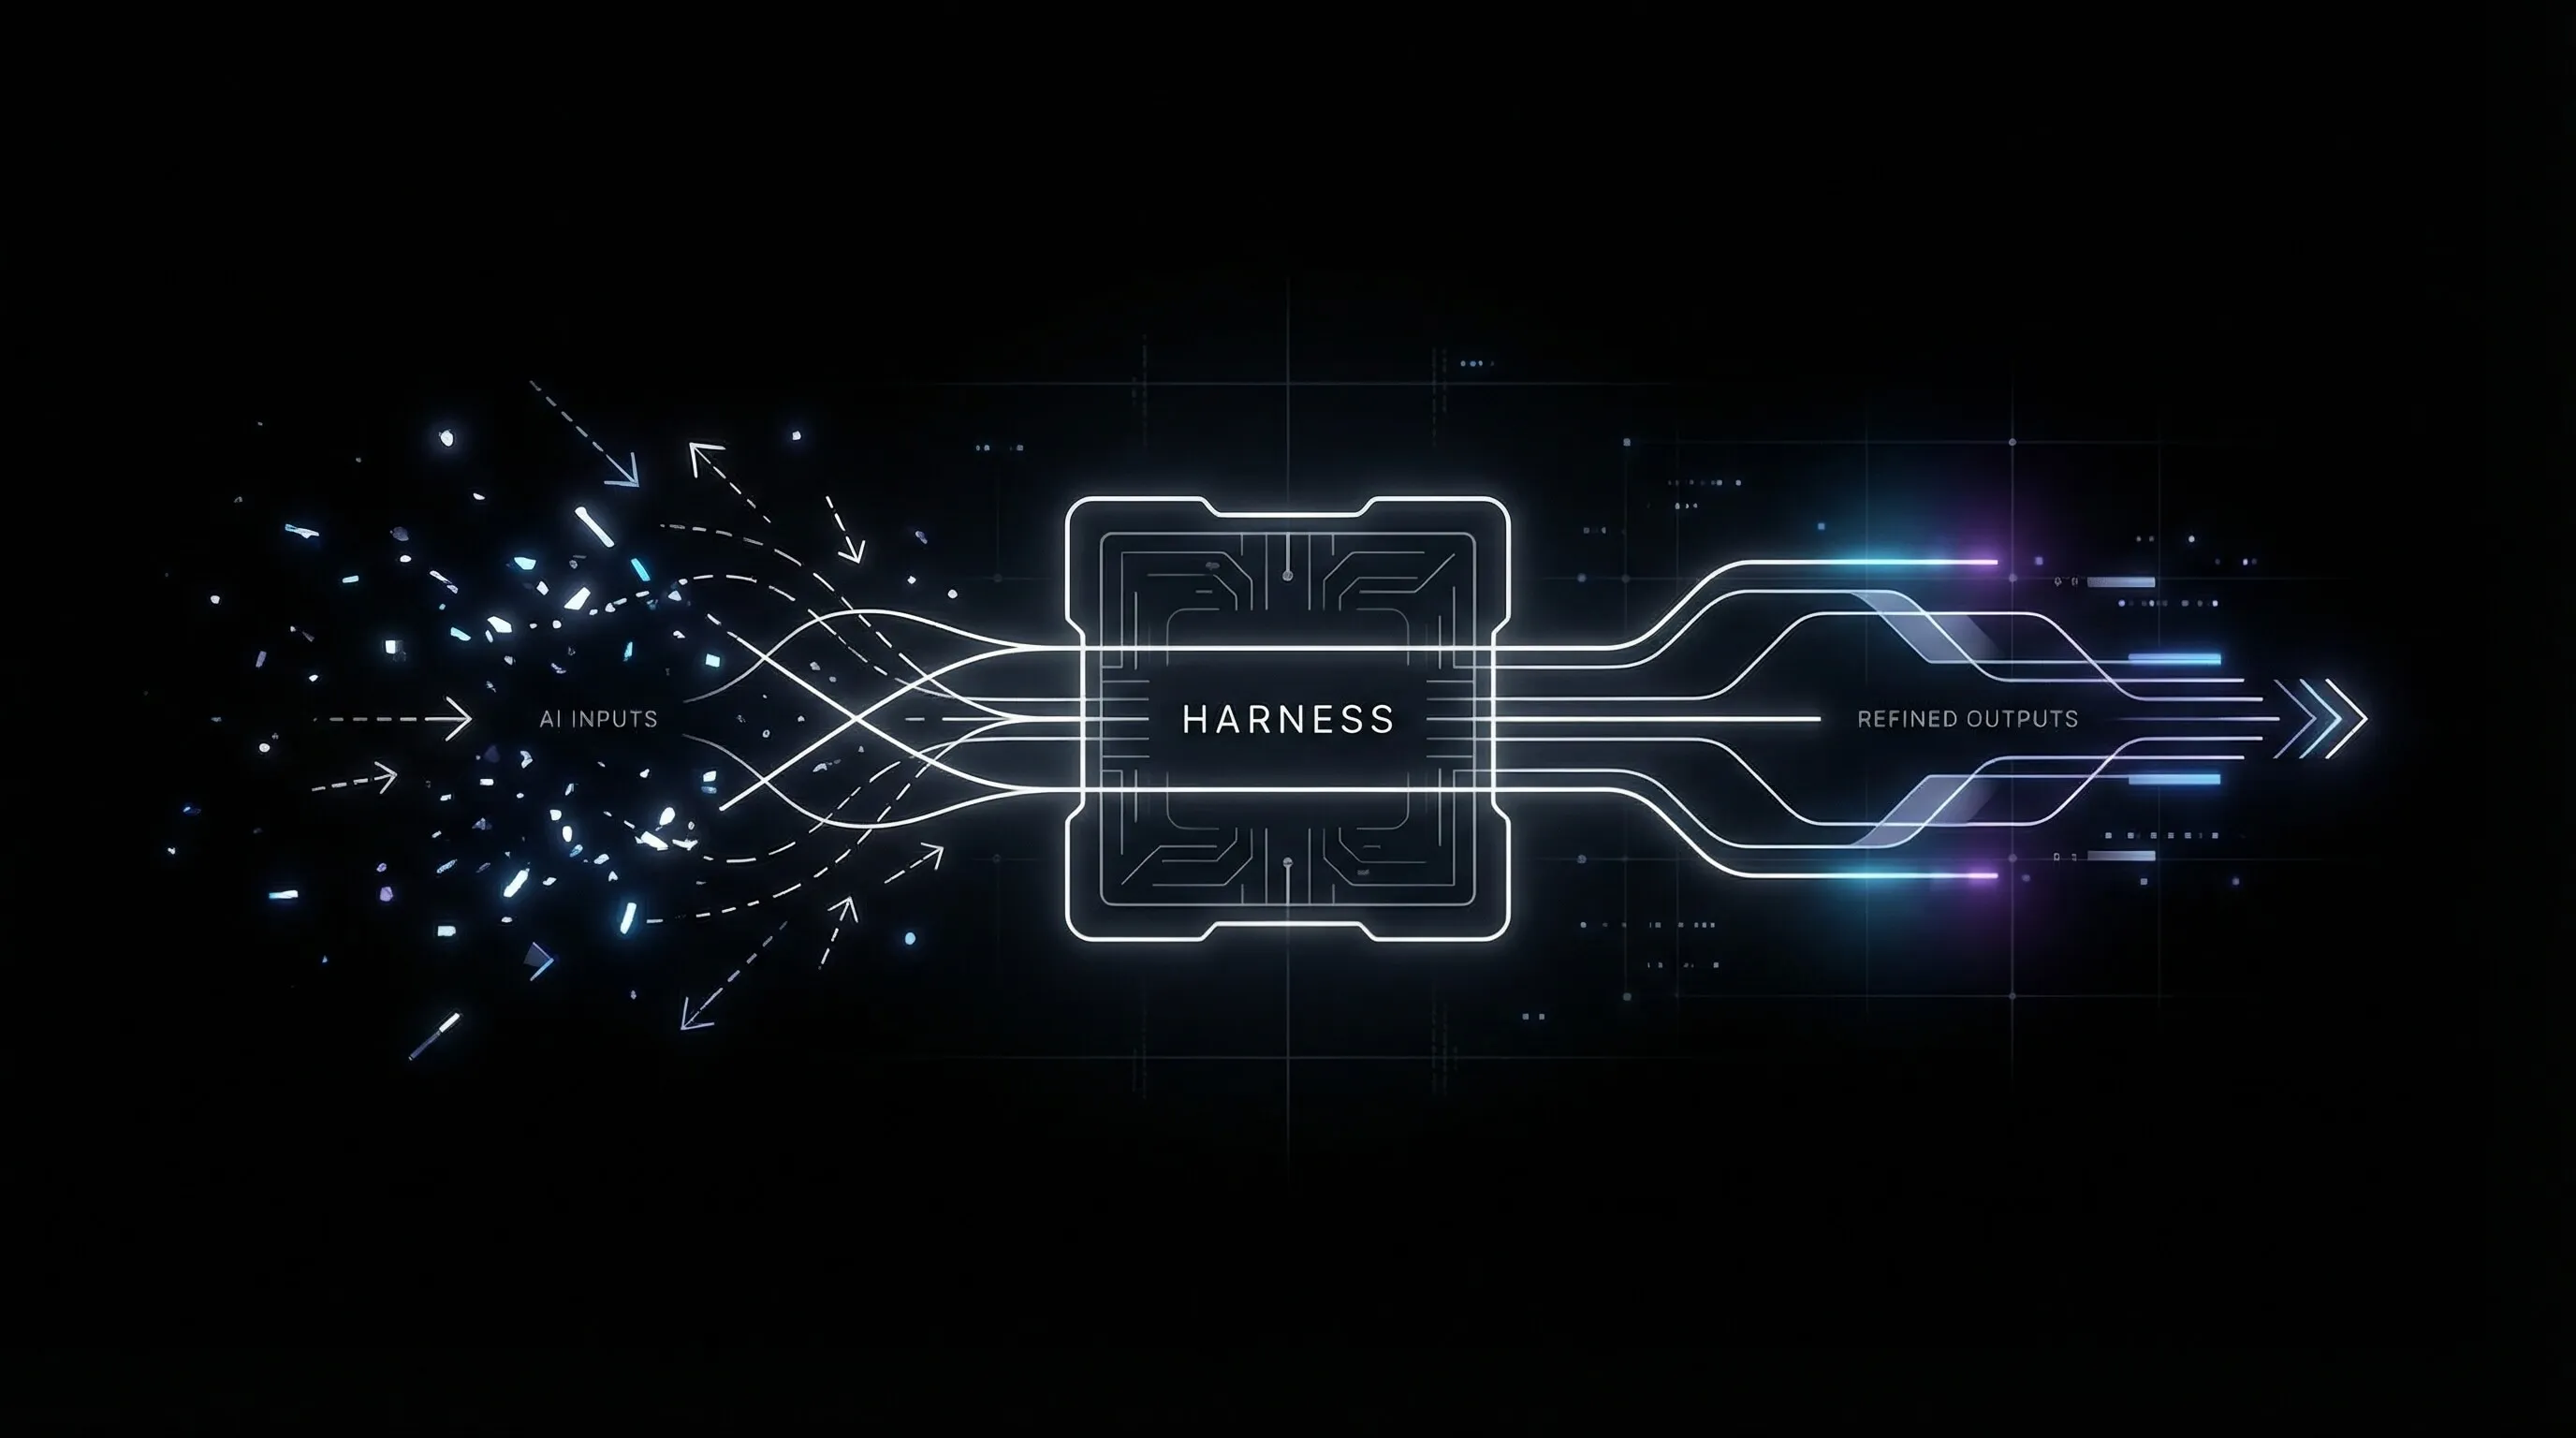
We built a system that handles production bugs autonomously: triages the alert, investigates in parallel, identifies the root cause, reproduces the bug in a sandbox, writes a patch, verifies it, writes a regression test, and ships a PR. When it works end-to-end, the engineer never touches the bug. When it can't fully resolve the issue, it hands the engineer a complete diagnosis and a suggested fix instead of a raw Sentry alert.
Root cause accuracy: 92.4%. Bugs that make it all the way to a shipped PR with zero human involvement: 35.8%. Median time from alert to diagnosis: 4 minutes 12 seconds. Median time to shipped PR: 22 minutes. The same bugs were taking engineers two-plus hours.
The Bug That Made Us Build This
Three weeks before we started, an engineer spent the better part of an afternoon debugging a null reference error in our enrichment pipeline. The Sentry alert showed TypeError: Cannot read property 'org_id' of null in the contact enrichment worker. Straightforward-looking stack trace. The engineer pulled up the logs, checked the recent deploys, read through the relevant code, and started building a reproduction.
The first deploy looked clean. The second deploy looked clean. The logs showed the error firing intermittently. The engineer spent forty minutes checking whether it was a race condition, then another thirty minutes checking whether a migration had left some records in a bad state, then finally found the actual cause: a third-party webhook was sending contact updates with a slightly different payload schema than what we'd specced. Our validation layer passed it through because it checked for the field's existence but not its type. The field existed. It was null.
Two hours and fifteen minutes. The fix was four lines. The regression test was twelve lines. The PR took five minutes to write once the engineer knew what was wrong. The entire two hours was information gathering and hypothesis elimination, exactly the kind of work that an LLM with access to logs, code, and metrics can parallelize.
One Sandbox, Many Agents
The system runs inside a single E2B sandbox running Claude Code. When an alert fires, the sandbox starts and Claude Code reads a supervising skill file. The skill file provides guidance rather than a rigid pipeline. It describes the phases of a debugging investigation (triage, classify, reproduce, patch, verify, regression test, ship), the artifacts each phase should produce, the rules for when to skip phases, and the coordination protocol for how sub-agents share findings.
Claude Code reads this guidance and then makes its own decisions. It decides how many sub-agents to spawn for investigation, when enough findings have accumulated to move to the next phase, and whether a bug needs reproduction or whether the evidence is strong enough to patch directly.
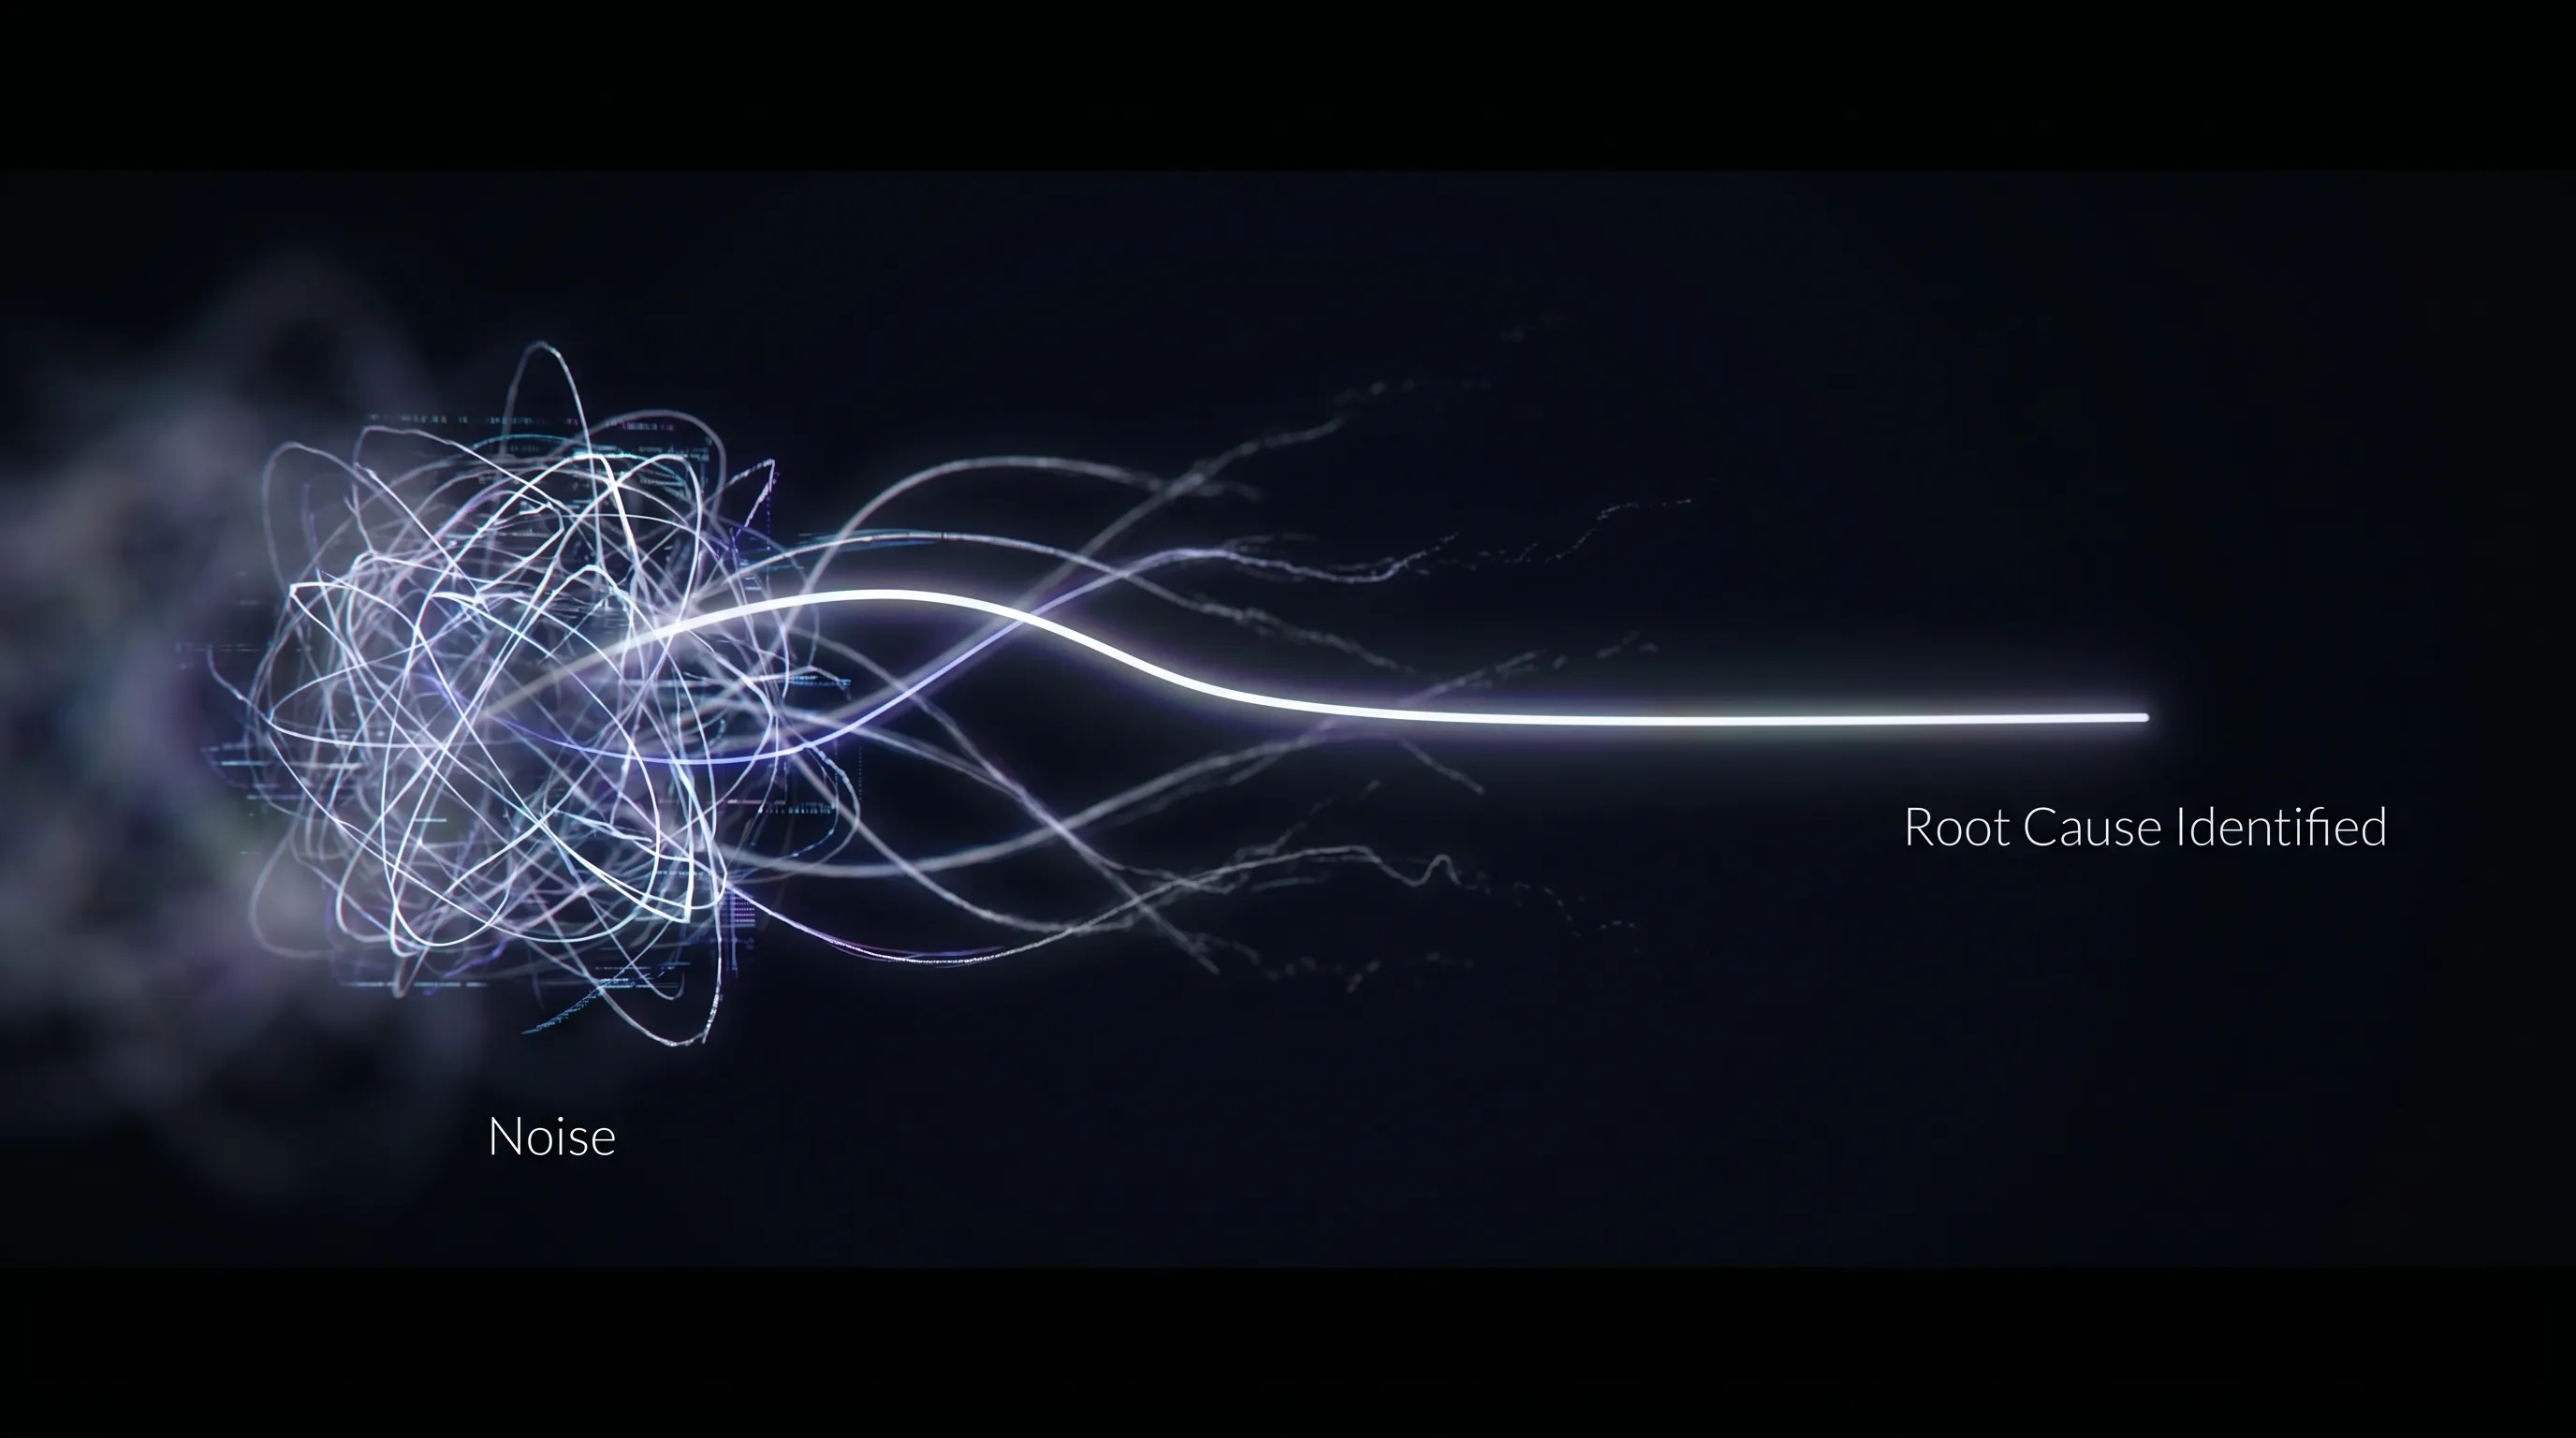
For a typical production error, it spins up six to ten concurrent investigation sub-agents, all running inside the same sandbox. One reads the Sentry error and the full stack trace. One pulls the log window from five minutes before and after the error timestamp. One checks Datadog metrics for the affected service. One pulls recent deploy diffs and correlates their timestamps with the error onset. One reads the relevant source files, starting from the stack trace and expanding outward. One checks for similar past incidents in the internal incident log. If the error involves a third-party integration, another sub-agent checks the integration's status page and recent changelog.
They all run simultaneously, reading from and writing to the same set of files in the sandbox: a state.json that accumulates structured findings, and individual artifact files (triage.md, investigation.md) that each sub-agent appends to.
A human engineer does these steps sequentially: check the error, then check the logs, then check the deploys, then check the metrics. That's forty-five minutes of serial investigation. The agent does them all at once. The four-minute diagnosis time doesn't come from any individual investigation being faster. It comes from running them in parallel and sharing findings in real-time.
How Sub-Agents Coordinate
This is the part that took us the longest to get right. When you have eight sub-agents all investigating the same production error concurrently, three things go wrong by default.
40% of investigation work was redundant until we added a claim protocol
The log agent reads the deploy history "just for context." The deploy agent reads the logs "to correlate timestamps." The metrics agent pulls the same Sentry event detail that the Sentry agent already has. Without coordination, about 40% of the investigation work is redundant. Eight agents doing the work of five.
The fix is a claim protocol in state.json. Before an agent starts investigating a specific thread, it writes a claim:
{
  "claimed_by": "deploy_agent",
  "thread": "deploy_correlation_2_15pm",
  "claimed_at": "timestamp"
}
Other agents see the claim and skip that thread. If an agent finds something unexpected outside its lane (the metrics agent notices an upstream dependency also spiking), it writes a new claim for that thread rather than investigating it itself. It's telling the swarm: "someone should look at this."
Claims expire after 60 seconds to handle agents that crash or get stuck. The whole mechanism is maybe twenty lines of code. Duplicate investigation work dropped from ~40% to under 5%.
Sharing reasoning between agents made them dumber
This one was counterintuitive. We initially had sub-agents write their full reasoning chains to the shared state. The log agent would write: "I see OOM kill events at 3.2x the baseline rate, starting at 14:23. This is likely a memory leak introduced in the allocator change from PR #4821, because the timing correlates with the deploy at 14:20 and the change modifies the object pooling logic."
The metrics agent reads this, and now it's anchored. Instead of independently analyzing the metrics, it starts looking for evidence that confirms the memory leak hypothesis. It focuses on memory metrics and ignores the CPU spike and the upstream latency anomaly that are also in the data. When the log agent's hypothesis is right, this speeds things up. But the log agent is wrong about 30% of the time, and when it's wrong, the metrics agent misses the actual root cause because it's confirmation-biasing toward the wrong hypothesis.
Accuracy improved significantly when we stripped reasoning from the shared state and only shared structured conclusions:
{
  "finding": "oom_kill_rate_elevated",
  "service": "enrichment-worker",
  "magnitude": "3.2x_baseline",
  "onset": "14:23:07",
  "correlated_deploys": ["PR #4821 at 14:20"],
  "confidence": 0.72
}
Structured facts without narrative or causal hypothesis. Now when the metrics agent reads this, it knows memory is a thread to investigate, but it forms its own explanation. It does its own analysis and sometimes disagrees: "the memory spike is a symptom, not the cause; the actual anomaly is a 4x increase in inbound webhook volume starting at 14:21, which preceded the deploy."
The disagreement between agents is where the real root cause lives. When two agents converge on the same root cause from independent evidence, accuracy is very high. When they disagree, the disagreement itself is a signal that the supervising agent uses to launch more targeted investigation.
This felt wrong to us at first, because shouldn't more transparency help? In a multi-agent system, reasoning transparency creates cognitive conformity. Keeping each sub-agent's analysis independent is what makes the consensus signal trustworthy. It was the single biggest accuracy improvement we made.
Without a stopping signal, investigation takes 20 minutes instead of 4
Investigation sub-agents will keep investigating forever if you let them. The metrics agent will pull every dashboard, the log agent will widen the log window to an hour, the code agent will trace the call graph six levels deep.
The supervising agent handles this. It watches state.json as findings accumulate. When enough sub-agents have written findings with sufficient confidence, and those findings converge (or clearly disagree in a way that narrows the hypothesis space), the supervisor terminates remaining investigation sub-agents and moves to classification. "Enough" is defined in the skill file guidance, but the agent interprets it. Sometimes it waits for a slow sub-agent because the existing findings are inconclusive. Sometimes it moves fast because three agents all pointed at the same deploy.
A static pipeline would wait for all agents to finish, or use a fixed timeout. The supervising agent makes a judgment call: "I have six findings with high confidence pointing to a webhook payload issue. The two remaining agents are checking infrastructure metrics that aren't relevant to a payload bug. Killing them and moving to classification."
Classification Determines Whether the Agent Attempts a Fix at All
Not every production error is a code bug. Getting this classification wrong in either direction is expensive: classifying an infrastructure issue as a code bug wastes twenty minutes trying to reproduce something that can't be reproduced. Classifying a code bug as a flake means the bug festers.
The supervising agent launches classification sub-agents that read the investigation findings from state.json and independently vote on one of four categories:
Application code bug. Something is wrong in the code. It's reproducible, fixable with a code change, and a PR is the right output. Full pipeline: reproduce, patch, verify, regression test, ship.
Infrastructure issue. The pods are OOM-killing because the memory limit is too low, or the database connection pool is exhausted from a config change. Application code can't fix these. The agent writes a diagnosis with specific evidence and recommended action. "Worker pod memory limit is 512MB, peak RSS in the last hour is 1.4GB. Raise the limit to 2GB. Here's the relevant Kubernetes manifest."
Bad user or database state. A customer's account record has a null org_id because a migration ran incompletely three months ago. The data is corrupt in a way that application code was never designed to handle. The agent identifies the corrupt records, explains what caused the corruption if it can, and writes the remediation steps. "Account ID abc123 has a null org_id from the January schema migration. 14 other accounts are affected. Here's the corrective query."
Flake. The reproduction sub-agents try five times. It works three times and fails twice. That's a non-deterministic failure, usually a race condition or a timing-dependent issue. The agent can't write a reliable reproduction, so it can't write a reliable patch. Instead it writes a flake report: failure pattern, triggering conditions, frequency, and a hypothesis about the underlying race condition. "This error fires approximately 35% of the time under >200 concurrent webhook deliveries. The likely cause is a race between the payload validation goroutine and the database write goroutine. The webhook handler does not acquire a lock on the contact record before validation. This flake is not customer-facing (the retry succeeds) and fires fewer than 50 times per day."
When the sub-agents disagree on the bucket, the system doesn't guess. It writes up both hypotheses with evidence and flags it for human review. About 12% of bugs land in this ambiguous zone. The human still gets the full investigation and both hypotheses, so their review takes five minutes instead of two hours.
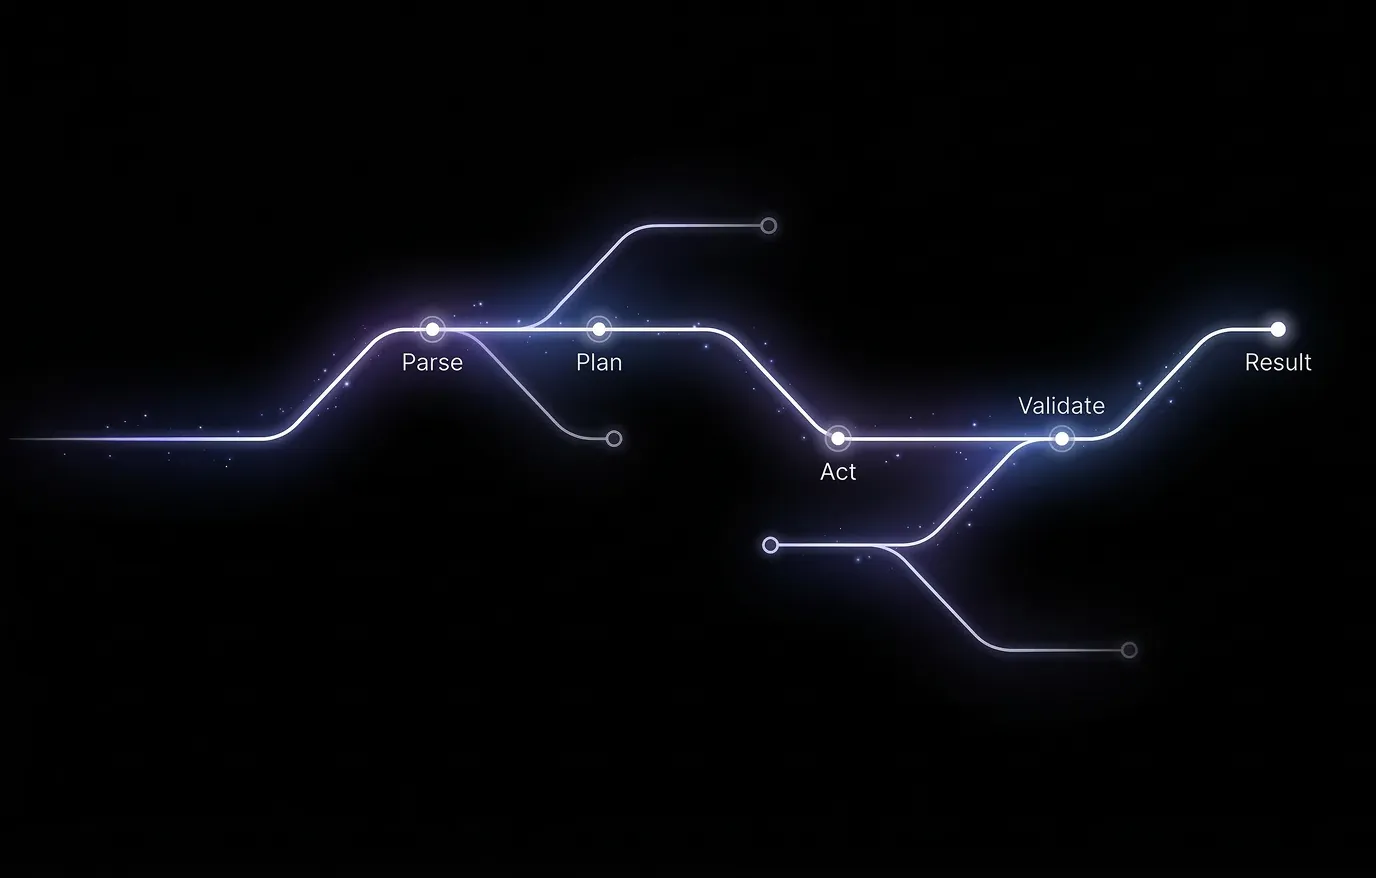
Reproduce, Patch, Verify, Test, Ship
When a bug is classified as an application code bug with high confidence, the full pipeline kicks in.
The agent writes a minimal reproduction script that triggers the exact error from the production alert, then runs it inside the sandbox. If the error signature matches the production error (same exception type, same stack trace structure, same error message), the reproduction is confirmed. If it doesn't match, the agent tries a different strategy. Maybe it needs to set up specific database state first, or simulate concurrent requests. The supervising agent might launch two or three reproduction sub-agents trying different approaches in parallel. The first one that produces a confirmed match wins.
The reproduction script becomes the ground truth for everything downstream. The patch has to make this script pass. The regression test is a cleaned-up version of this script that gets committed to the repo.
For patching, the agent reads the confirmed reproduction, the relevant source code, and chained skill files that describe the repo's architecture and coding conventions. Without the skills, the agent writes patches that fix the symptom but violate the codebase's patterns: using a different error handling style, importing utilities the codebase doesn't use, writing the fix in the wrong abstraction layer. With the skills, the agent's patch looks like something an engineer on the team would have written. The supervising agent sometimes launches two patch sub-agents with different strategies (minimal targeted fix vs. broader root cause fix) and tests both in parallel.
Verification runs the reproduction script with the patch applied, then runs the full existing test suite. If the patch fixes the reproduction but breaks an existing test, the agent goes back to patching with an additional constraint. If it can't find a patch that satisfies both, it writes up the conflict for human review.
The regression test must fail on the pre-patch code and pass on the post-patch code. This is non-negotiable. If the agent can't produce a test with this property, the pipeline stops. The regression test is what makes the PR reviewable: an engineer reading it can immediately understand what the bug was, how it was triggered, and what the fix does.
If every gate passes, the agent pushes a PR. The PR description includes the full diagnosis, the reproduction steps, the root cause analysis, and links to the original alert. In our experience, most review is rubber-stamping. The engineer spends two minutes reading instead of two hours investigating.
Nine Bad PRs in One Week Taught Us About Confidence Gating
We learned this the hard way. In the first week without confidence gating, the agent shipped 23 PRs. Fourteen were correct. Nine were wrong: wrong root cause, wrong fix, or a fix that addressed a symptom rather than the underlying bug. Nine bad PRs in a week would destroy engineering trust faster than having no system at all. An engineer who merges a bad auto-generated PR and then has to debug the debug agent's work will turn the system off.
Every phase now produces a confidence score written to state.json:
- Classification confidence: how clearly the evidence points to one of the four buckets.
- Reproduction confidence: whether the reproduction matches the production error. We don't just string-match the error message. The agent compares exception type, stack trace structure, and the specific assertion that fails.
- Patch confidence: how invasive the fix is. A four-line change in one file with no shared dependencies is low-risk. A twelve-line change that touches a utility function used by six services is high-risk. The confidence score penalizes blast radius.
- Test confidence: whether the regression test actually tests the bug. The agent checks that the test fails without the patch and passes with it, and that it's testing the specific behavior that was broken.
The supervising agent computes a composite confidence from all four signals. Only PRs above the threshold get shipped. Everything below produces the full diagnosis, reproduction script, and suggested patch with an explanation of why confidence was too low. The human gets a 70% complete solution instead of a raw alert, but the system doesn't push a PR it isn't confident about.
The 35.8% auto-ship rate is the confidence system working. It's not a failure that 64.2% of bugs don't auto-ship. The system is correctly identifying cases where it's not confident enough: ambiguous root cause, reproduction that doesn't quite match, patch with too much blast radius. Even these "failures" save an hour of engineering time because the investigation and diagnosis are done.
We tuned the threshold empirically. Too low and bad PRs slip through. Too high and the auto-ship rate drops below 20% and engineers feel like the system never finishes. The current threshold gives us 35.8% auto-ship with a false positive rate under 3%.
Security: Customer Data Cannot Leave the Sandbox
Our agent needs production context to diagnose bugs. Stack traces contain function arguments. Log lines contain request payloads. Error messages contain customer identifiers. This is real customer data and it cannot leave our infrastructure.
The E2B sandbox has no direct access to production systems. Instead, we use the same gateway architecture from our coding agent infrastructure: a short-lived session token, scoped to this specific debugging session, that permits read-only access to specific data through our API gateway.
The gateway sanitizes data before it reaches the sandbox. Customer IDs are replaced with synthetic hashes. Request payloads are truncated and stripped of PII. Stack trace arguments that contain sensitive data are redacted. The agent sees structurally identical data (same error paths, same data shapes, same failure modes) with no real customer information.
The reproduction runs against synthetic test fixtures inside the sandbox. The skill files include patterns for generating representative test data for each service domain. The agent writes a reproduction that triggers the same code path with synthetic data that has the same structural properties as the data that caused the production error.
Token lifecycle: generated before the sandbox starts, scoped to read-only operations, automatically invalidated when the session ends, TTL of 10 minutes maximum. If the session crashes without cleanup, the token expires anyway.
What Didn't Work
One big agent doing everything. Our first version was a single Claude Code session that tried to handle every phase in one conversation. It worked on simple bugs. On anything complex (multiple services involved, ambiguous root cause, deep call stacks), it ran out of context window at the diagnosis stage and hallucinated a fix without ever confirming the root cause. Splitting into parallel sub-agents that each hold only their slice of the investigation solved this.
Static sequential pipeline. Before we let the agent decide what to launch, we had a hardcoded sequential pipeline: triage, classify, reproduce, patch, verify, test, ship, always in that order, one sub-agent per phase. Reliable but slow. Fifteen minutes to diagnosis because each phase waited for the previous one. And fragile: if reproduction failed, the entire pipeline stalled even when the agent had enough evidence to produce a useful diagnosis without reproduction. The agent-directed approach works better because it makes judgment calls. "I can't reproduce this one, but the investigation findings are strong enough to suggest a fix. Let me try patching based on the root cause analysis alone and see if the existing tests can validate."
Sharing reasoning traces between sub-agents. Described above. When sub-agents write their full chain-of-thought to the shared state, other agents anchor on that reasoning and stop thinking independently. The shift to structured conclusions was the single biggest accuracy improvement. In a multi-agent system, reasoning transparency creates cognitive conformity. Independence is what makes the consensus signal trustworthy.
Letting the agent attempt fixes for non-code problems. Early on, the system would try to write code patches for infrastructure issues and bad database state. A misconfigured memory limit would produce a patch that added a try/catch around the OOM-prone code path. Technically the patch "fixed" the error by swallowing it, but obviously didn't fix the problem. The four-bucket classification with hard skip rules solved this completely.
The Numbers
The 35.8% auto-ship rate means roughly a third of production bugs go from alert to merged PR without a human touching them. The 92.4% root cause accuracy means that even when the system can't auto-fix, the engineer gets a correct diagnosis with evidence. And the ~60% of remaining bugs that produce a useful diagnosis but no PR still save the engineer the worst part, the two hours of investigation, leaving them starting from a suggested fix and a reproduction script.
We were losing eight engineer-days per week to maintenance. Those are days that can now go toward building the product. We're a twenty-person engineering team trying to build an AI-native replacement for Salesforce. Buying back two full engineers' worth of capacity is the difference between shipping our agent runtime on schedule and not.
What We Ended Up With
One E2B sandbox per debugging session. Claude Code as the runtime. A supervising skill file that provides the phases, the artifacts, the coordination rules, and the classification taxonomy, with the agent making all the decisions. Many sub-agents launched in parallel, coordinating through a shared state.json and structured artifact files. A claim protocol that prevents duplicate work. Structured conclusions instead of reasoning traces to preserve sub-agent independence. A four-bucket classification that hard-stops the pipeline for non-code problems. A confidence gate that prevents bad PRs. An API gateway that air-gaps customer data from the sandbox.
None of this was in the first version. The first version was one agent, one conversation, no coordination, no confidence gating, reasoning traces everywhere. Every piece of the current architecture exists because something broke and we had to fix it. The claim protocol exists because agents were duplicating 40% of investigation work. The conclusions-over-reasoning protocol exists because agents were anchoring on each other's hypotheses and missing the real root cause. The four-bucket classification exists because the agent once tried to fix a Kubernetes misconfiguration by adding a try/catch. The confidence gate exists because nine bad PRs shipped in one week.
The supervising agent that reads the skill file and makes judgment calls is the piece that makes the whole system work. A static pipeline would be slower, more fragile, and less accurate. The model is good enough to make real-time decisions about how to investigate a bug. We gave it guidance about what phases exist and how agents should coordinate, then let it decide the specifics: how many agents to spawn, when to stop investigating, when to skip reproduction, when to kill a stalled sub-agent. The pattern that keeps emerging across everything we build is the same: as models get better, you get more out of informing them than constraining them.