


Every marketing platform with access to conversion data eventually publishes benchmarks. HockeyStack has done it. Others in the space have too.These reports are well-intentioned and directionally useful, but they’re built on a fragile assumption: that channel performance can be generalized.
Using data from 224 B2B SaaS companies, we set out to answer a simpler question:What does it actually take for a lead to convert?
In 2026, that question matters more than ever. Budgets are tighter, channel performance is more volatile, and marketing teams are under pressure to justify spend with hard data. In that environment, benchmarks are tempting shortcuts. They offer fast answers — but often without the context required to apply them correctly.
The impact of any channel on conversion changes materially based on:
- who you sell to
- the industry you operate in
- and how your go-to-market motion is designed and executed
Benchmark reports collapse all of that context into a single average. In doing so, they mask the reality that the same channel can perform exceptionally well for one company and poorly for another.
So for this report, we took a different approach.
Instead of ranking channels by average performance, we examined what actually changes the likelihood of conversion. We analyzed conversion rates across company segments and industries, and paired it with incrementality (lift) to understand not just where channels appear, but where they truly move outcomes.
What emerges is a clear but uncomfortable conclusion:
There is no universally “best” channel.
Channel performance only becomes interpretable when viewed through the lenses of buyer type, industry context, and GTM design.
- 224 B2B SaaS companies
- Regions: North America and Europe primarily
- Timeframe: Jan 1, 2025 – Dec 31, 2025
- SMB: 1–99 employees
- Mid-Market: 100–999 employees
- Enterprise: 1,000+ employees
- Primary Industry: Industry classification pulled from company data
- Industry Bucket: Simplified industry grouping for analysis
- Lead: First meaningful touchpoint
- Deals Created: Opportunity created in CRM
- Deals Qualified: Final qualification stage
- Closed Won: Signed contract
- Lead → Deal Created: Early interest converting into pipeline
- Deal Created → Closed Won: Pipeline converting into revenue
- Lift measures whether a channel increased the likelihood of Closed Won, not just whether it appeared in the journey
- Calculated by comparing conversion outcomes for deals with vs. without exposure to a given channel
- We primarily reference median lift, which reflects the typical impact of a channel and reduces distortion from outliers
- Linear attribution (equal credit to every touchpoint)
- Used to normalize results across different GTM motions, sales cycles, and channel mixes
- Outliers removed manually (misconfigured channels, incomplete onboarding)
- No blanket statistical filtering to avoid distorting real funnel behavior
Funnel Conversion Rates: The Overall Story
This section focuses on a single funnel transition: Lead → Deal Created.
It shows which channels are most likely to turn an initial lead into a real sales opportunity. These conversion rates highlight how different channels behave at the top of the funnel: which ones move leads into pipeline quickly, and which generate attention without triggering sales engagement.
When we narrow the lens to focus on a single outcome — turning leads into deals created — the differences between channels become a little more stark.
Some channels move leads into pipeline quickly and at scale.
Others generate enormous attention but rarely trigger sales engagement.
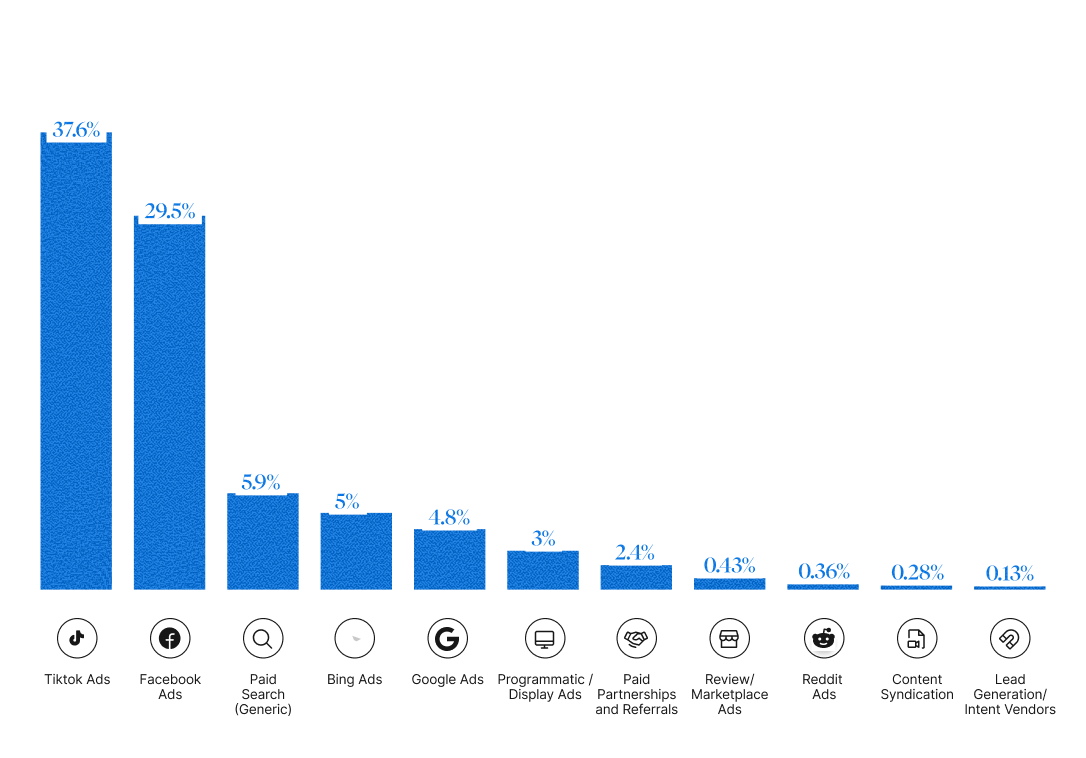
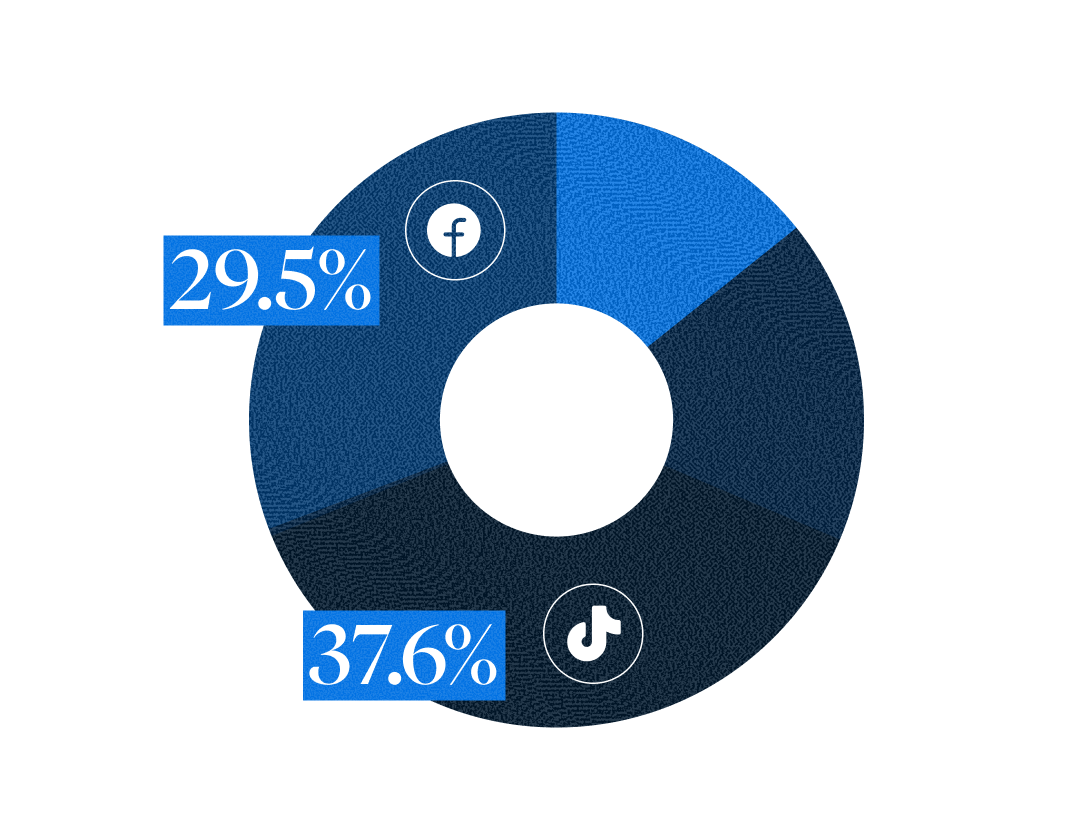
In this dataset, paid social converts leads into created deals faster than any other channel.
- TikTok Ads convert 37.6% of leads into deals, the highest rate in the dataset by a wide margin.
- Facebook Ads follow at 29.5%, combining high velocity with massive lead volume.
These platforms are exceptionally effective at pushing prospects into the CRM. When a lead engages, sales teams are often able to open a deal quickly.
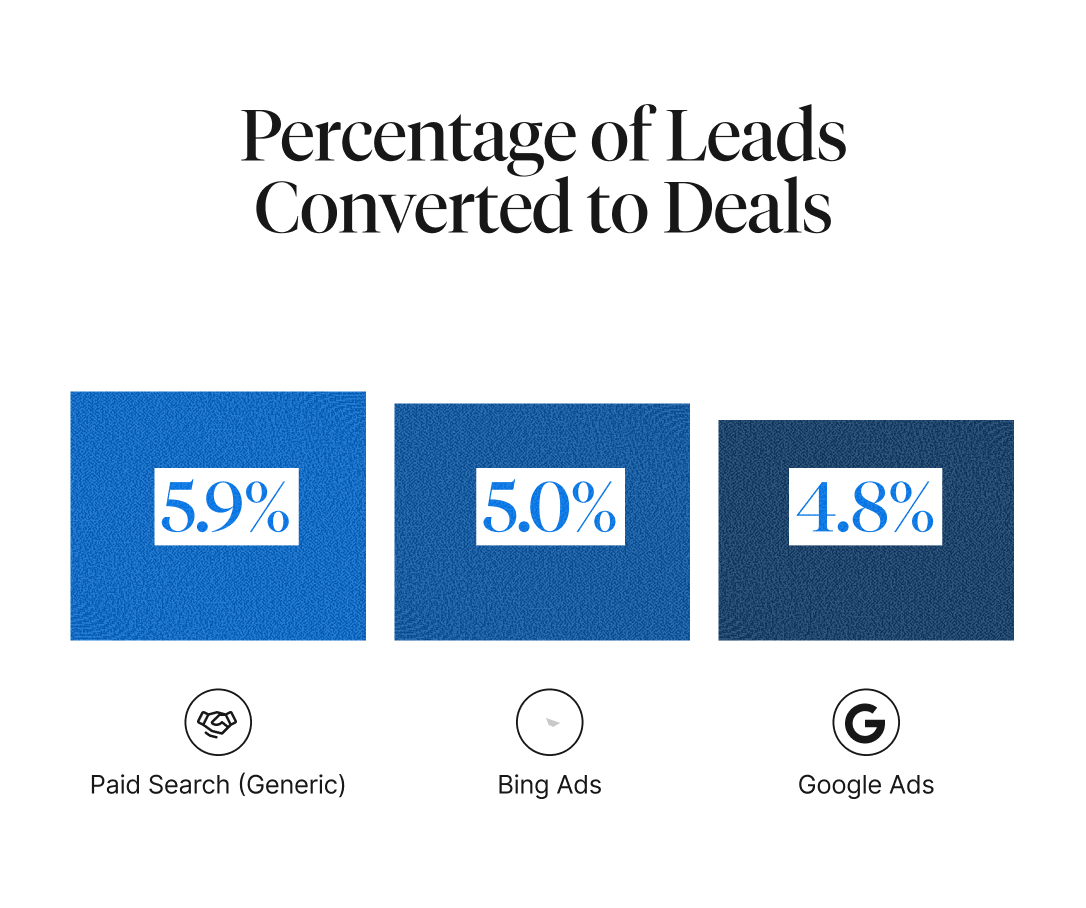
Search channels don’t produce eye-catching conversion rates, but they deliver consistent, high-intent pipeline.
- Paid Search (Generic) converts 5.9% of leads into deals.
- Bing Ads sit at 5.0%, nearly identical performance.
- Google Ads convert 4.8% of leads into deals, at far greater scale.
These leads are actively looking for solutions. They may convert more slowly than social, but they reliably become sales conversations because intent is explicit at the moment of engagement.
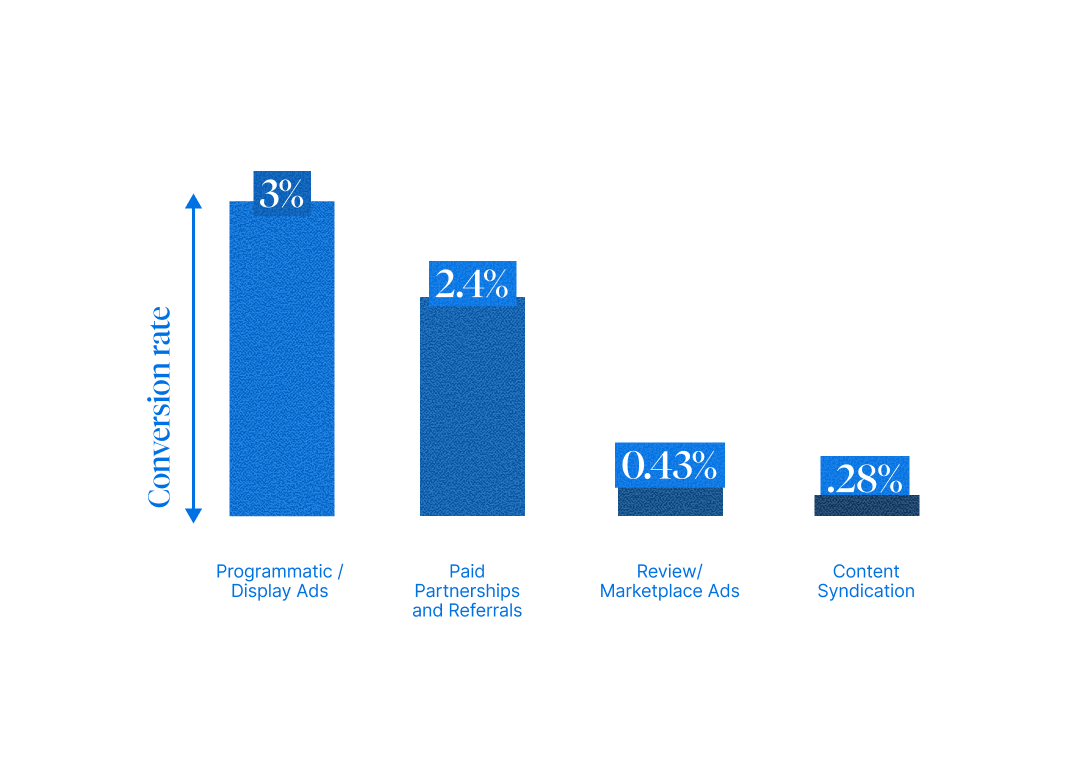
At the top of funnel, few channels generate more leads than referrals and content syndication. However, very few of those leads turn into created deals.
- Programmatic / Display Ads: 3.0%
- Paid Partnerships / Referrals: 2.4%
- Review / Marketplace Ads: 0.43%
- Content Syndication: 0.28%
They don’t generate pipeline at the scale of social or search, but they do convert when buyers are already researching or validating options. These channels tend to support discovery and consideration rather than pure demand capture.
Taken together, these conversion rates show that channels play very different roles in pipeline creation.Some channels accelerate leads into deals quickly. Others create steady, intent-driven opportunities. Many generate awareness but rarely initiate sales conversations on their own.But these patterns are still averages.
They don’t account for who the buyer is, what industry they’re in, or how the go-to-market motion is structured — factors that fundamentally change how and when pipeline gets created.
To understand which of these channels actually matter for a specific business, we need to add context.That starts with breaking conversion rates down by company segment.
Making Sense of Conversion Rates: By Segment
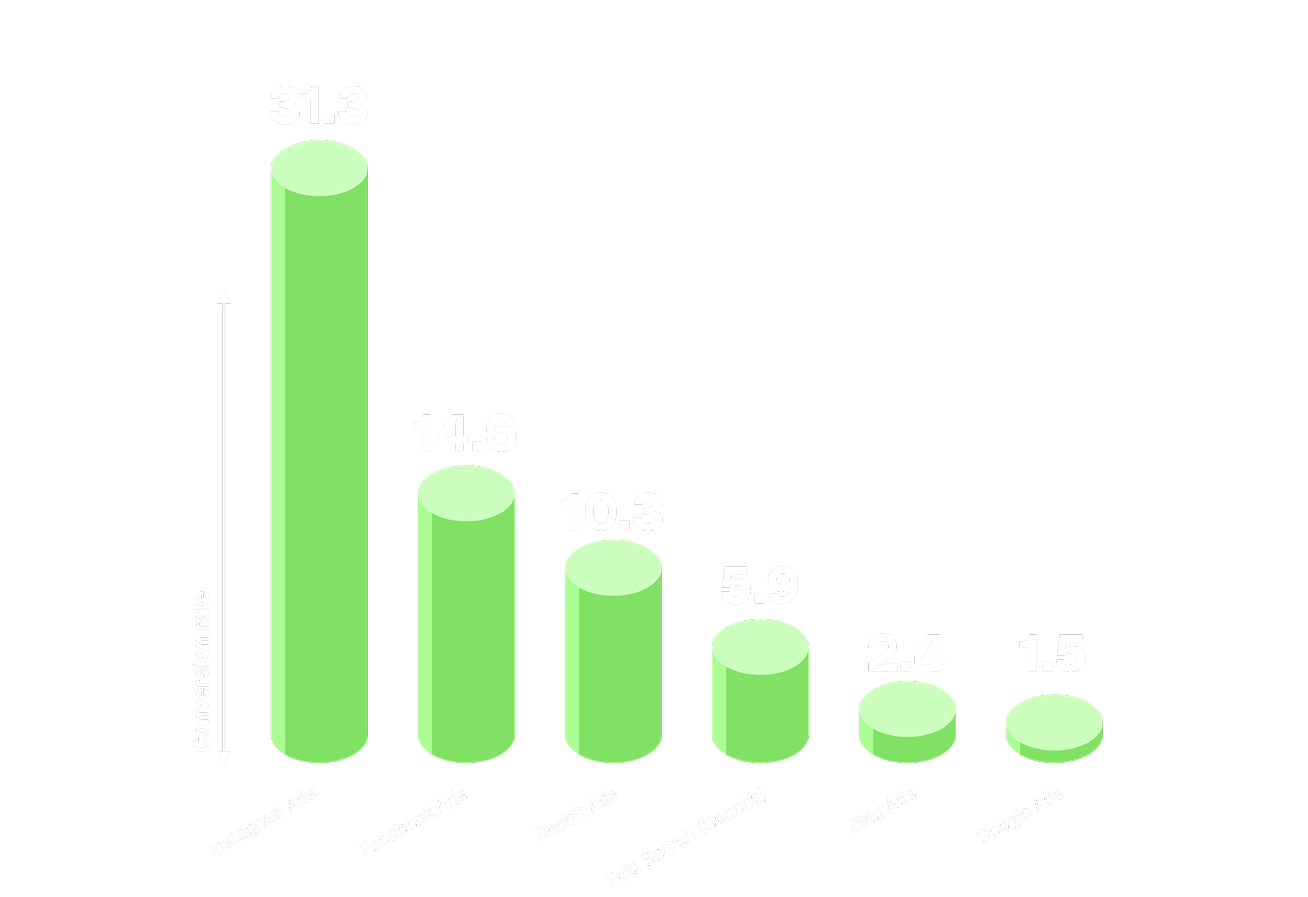
Small businesses convert leads into deals at the highest rates on social-driven channels.
- Instagram Ads: 31.3%
- Facebook Ads: 14.6%
- Reddit Ads: 10.3%
Search still contributes, but plays a secondary role:
- Paid Search (Generic): 5.9%
- Bing Ads: 2.4%
- Google Ads: 1.5%
SMB buyers are highly responsive to social discovery and move quickly from engagement to deal creation. Channels that reduce friction and encourage fast interaction perform best.
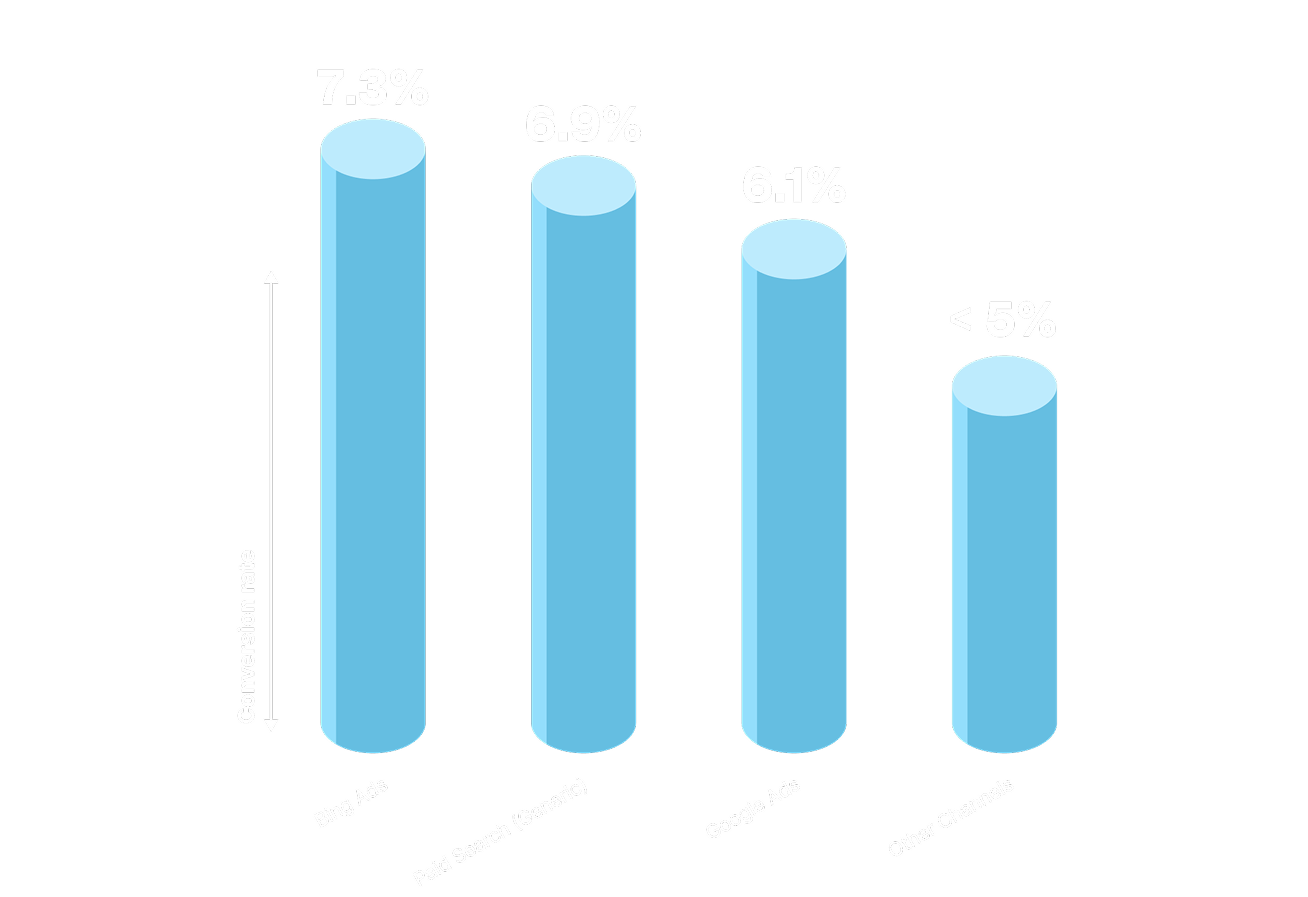
Enterprise conversion rates are lower across nearly every channel, reflecting longer, more deliberate buying cycles.
- Bing Ads: 7.3%
- Paid Search (Generic): 6.9%
- Google Ads: 6.1%
Most other channels — including social, programmatic, and content-led approaches — convert under 5%.Enterprise buyers rarely convert on impulse. Channels that capture explicit intent, particularly search, are the most reliable at turning leads into pipeline.
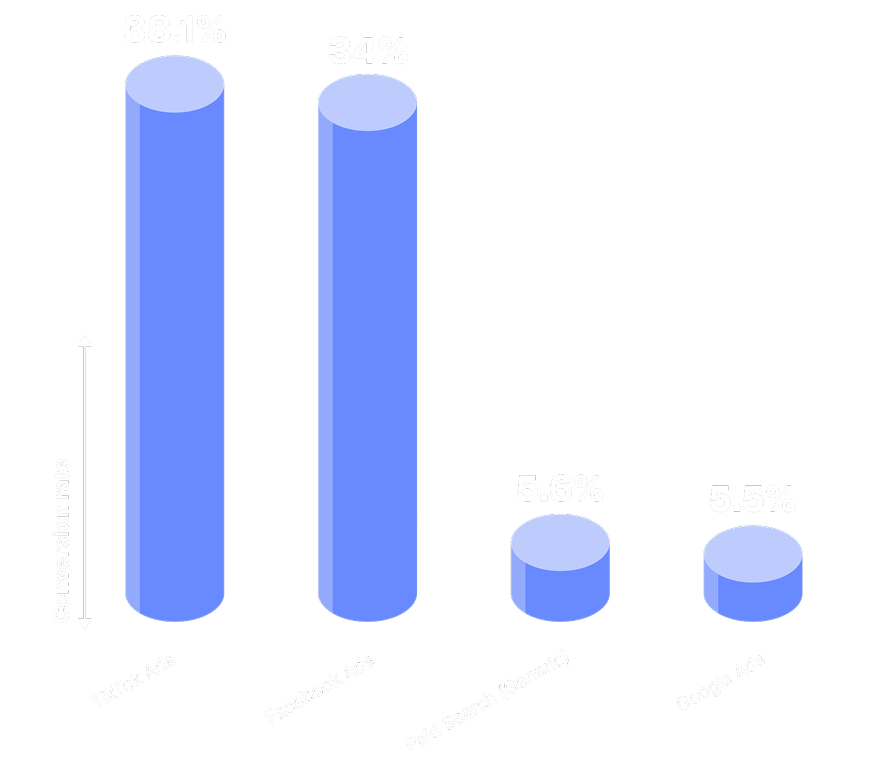
Mid-market performance is the least consistent across channels.
- TikTok Ads stand out dramatically, converting 38.1% of leads into deals.
- Facebook Ads also perform strongly at 34.0%.
- Paid Search (Generic) (5.6%) and Google Ads (5.5%) remain steady contributors.
Outside of a few standout channels, conversion rates drop off sharply. Many channels that perform well in SMB or enterprise show minimal impact in mid-market.This suggests the mid-market is not a single buyer profile, but a mix of behaviors that respond very differently depending on positioning, product complexity, and GTM motion.
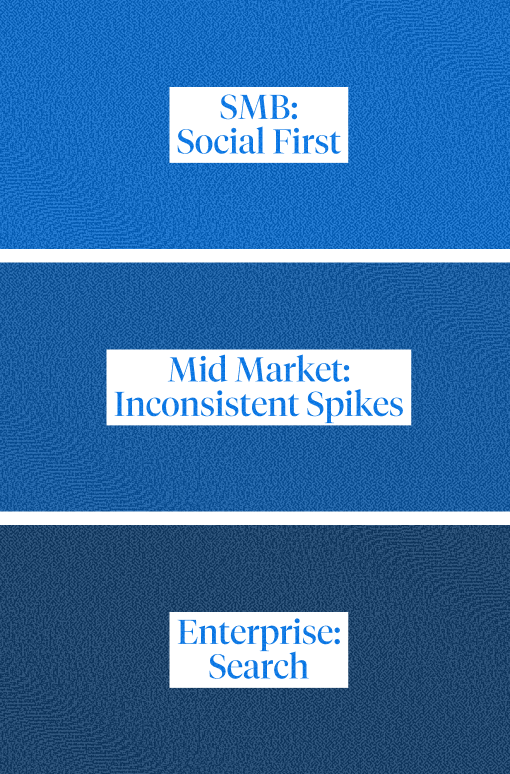
The building blocks for lead to deal conversion is highly segment-dependent.
- SMB pipeline is driven by social discovery and speed
- Enterprise pipeline is driven by intent capture and search
- Mid-Market shows sharp channel-specific spikes rather than consistent patterns
This is why aggregate conversion benchmarks break down. Without segment context, channel performance looks stable — and leads teams to the wrong conclusions.To go further, we need to add another layer of context: industry.
Making Sense of Conversion Rates: By Industry
Industry explains how they buy.
When we break Lead → Deal Created conversion down by industry, channel behavior shifts again — sometimes dramatically. Patterns that look stable at the aggregate or segment level often disappear or reverse entirely.

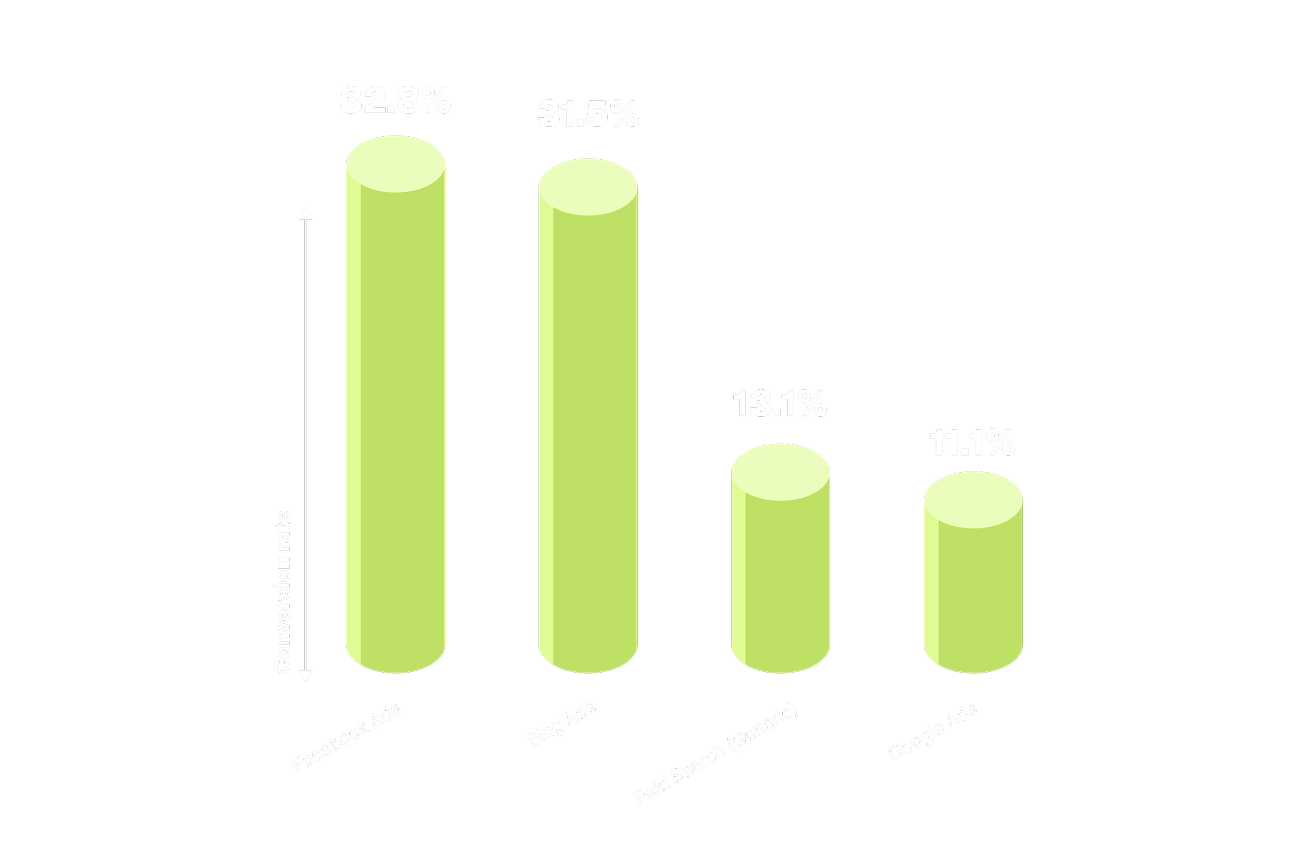
AI and data buyers show concentrated success in a small number of paid channels:
- Facebook Ads: 32.8%
- Bing Ads: 31.5%
- Paid Search (Generic): 13.1%
- Google Ads: 11.1%
The pattern is clear: strong pipeline creation, but limited evidence of fast decision-making. This likely reflects longer, more technical evaluation cycles where paid channels capture interest but don’t immediately drive commitment.

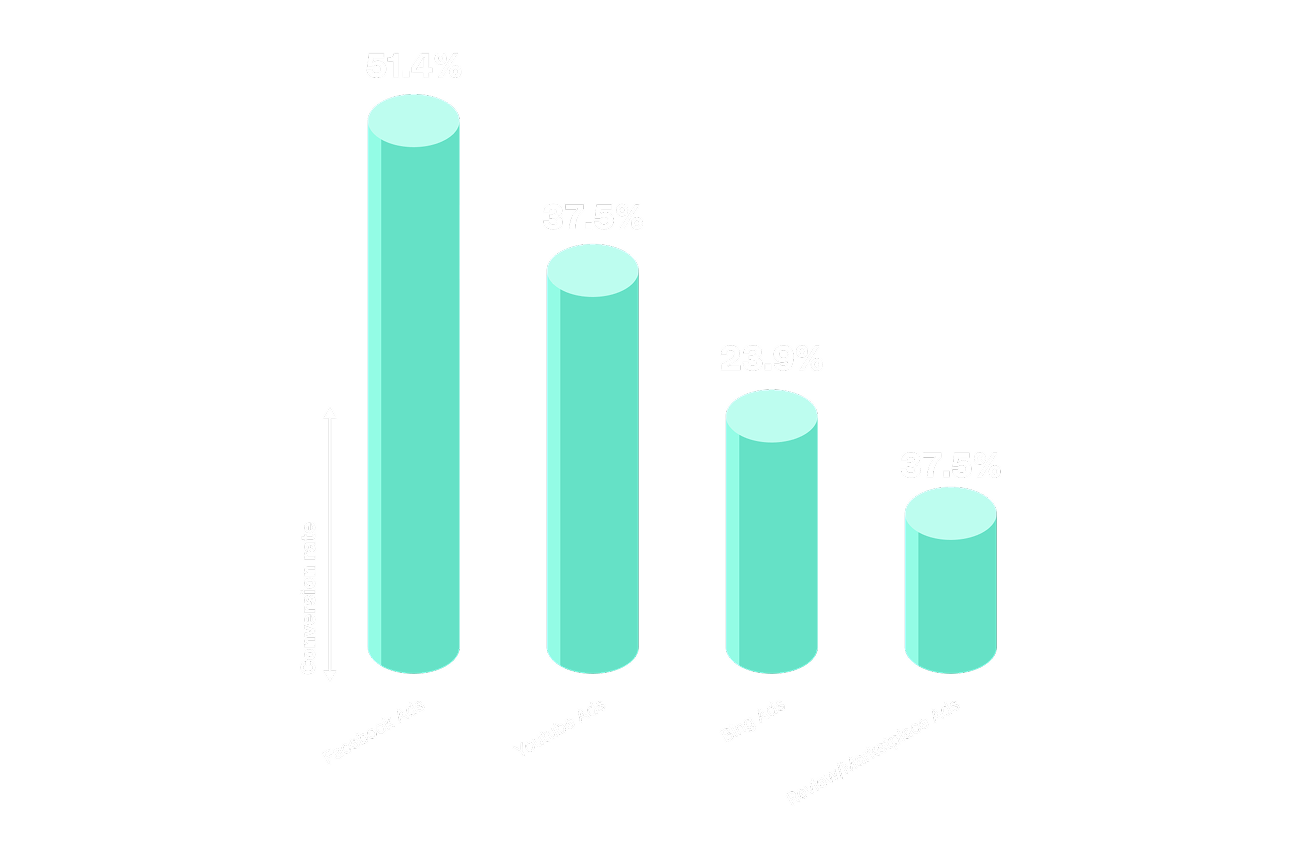
Healthcare buyers respond best to channels that support education and validation.
- Facebook Ads: 51.4% lead→created
- YouTube Ads: 37.5%
- Bing Ads: 23.9%
- Review / Marketplace Ads: 14.9%
Google Ads underperforms here (7.3%), suggesting that buyers prefer formats that allow deeper engagement before engaging sales.

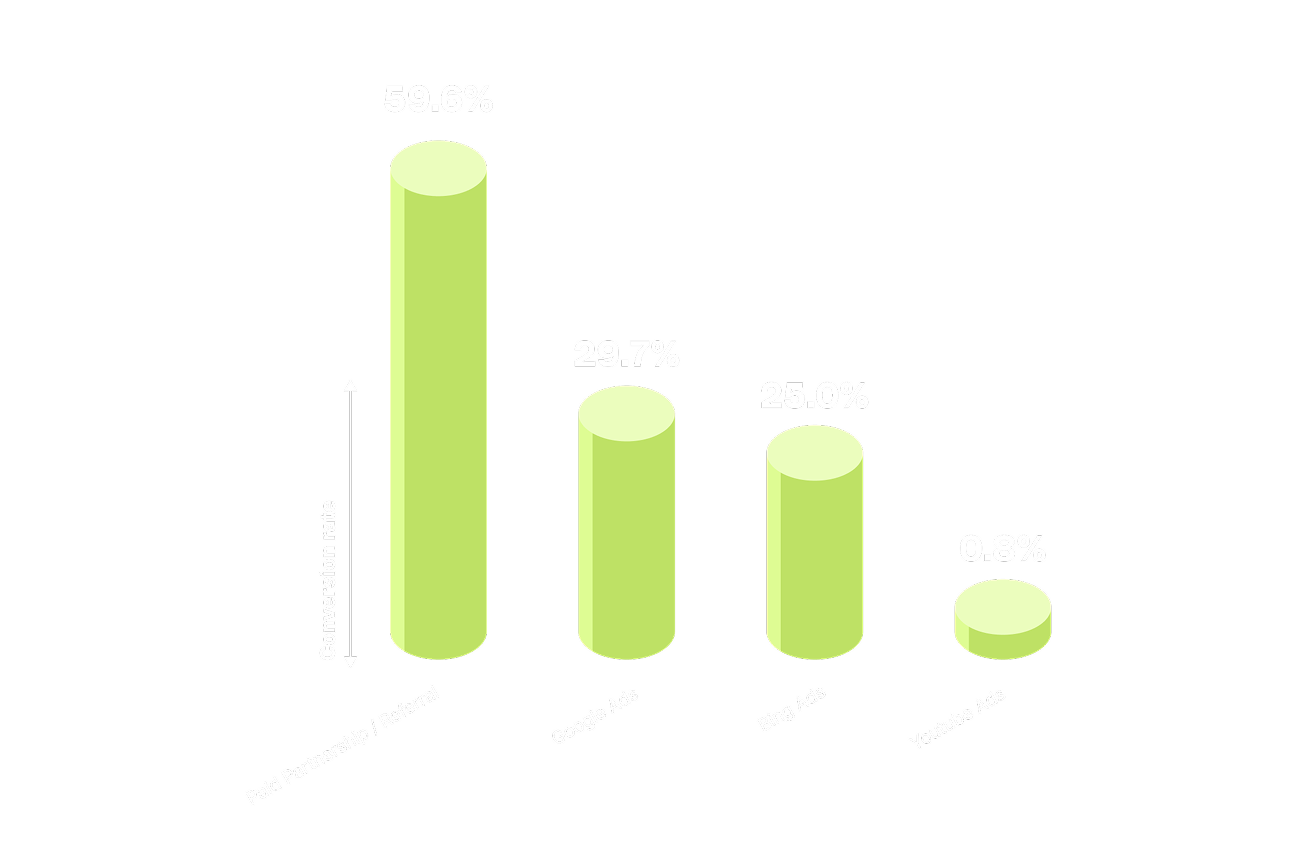
HR Tech shows strong performance across paid search, but partnerships stand out on pipeline creation.
- Paid Partnership / Referral: 59.6% lead→created
- Google Ads: 29.7%
- Bing Ads: 25.0%
- YouTube Ads: 0.8%
Paid partnerships convert leads into created deals at a far higher rate than any other channel, suggesting they are especially effective at surfacing HR buyers early.

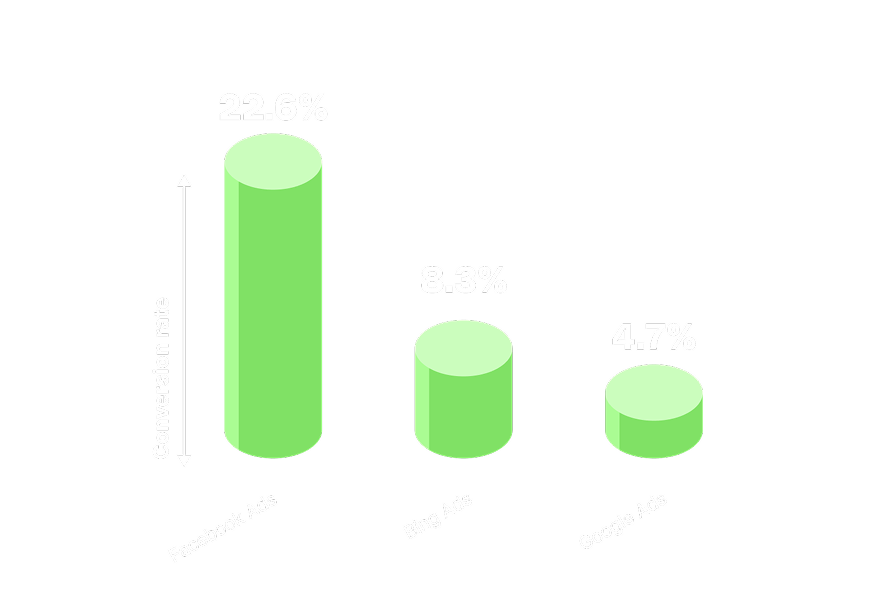
Financial services buyers behave predictably when it comes to pipeline creation, with search-led channels driving the majority of deals created.
- Facebook Ads: 22.6% lead→created
- Bing Ads: 8.3%
- Google Ads: 5.4%
Compared to other industries, pipeline creation in fintech is concentrated in fewer channels, with search consistently outperforming most alternatives.
Lead-to-deal conversion is deeply industry-dependent.
- Some industries convert aggressively through paid media
- Others rely on education, validation, or community
- Many show no single dominant channel at all
Without an industry lens, conversion benchmarks overstate consistency and understate risk. To understand which channels truly change outcomes, we now need to move beyond conversion rates entirely — and look at incrementality.

Conversion rates tell us which channels appear in deals.
Lift tells us which channels actually increase the likelihood of deal creation when present vs. absent.When we look at median lift on Deal Created across the same dataset, the rankings change immediately. Channels that dominate conversion journeys often show limited incremental impact, while others quietly drive real change.
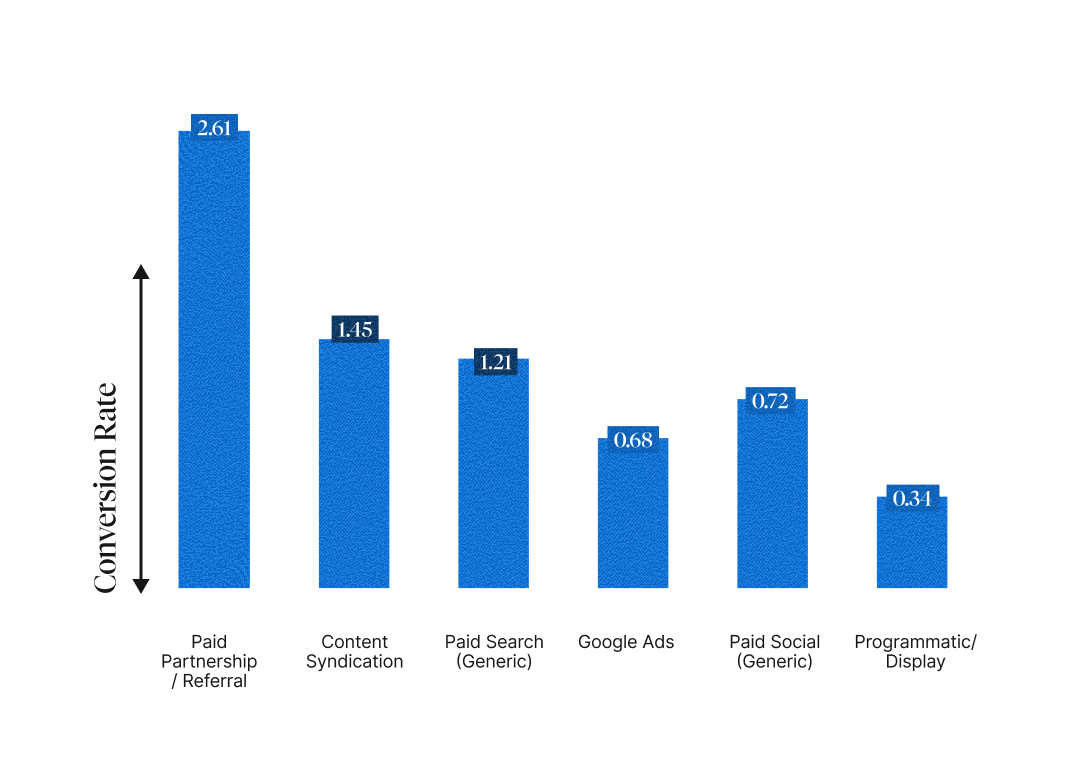
Across all companies, only a small group of channels show consistently positive median lift, meaning they typically increase the likelihood of deal creation:
- Paid Partnerships / Referral: 2.61× median lift
- Content Syndication: 1.45×
- Paid Search (Generic): 1.21×
These channels tend to introduce or reinforce information that meaningfully affects buyer behavior, rather than simply capturing demand that already exists.
By contrast, several highly visible channels show smaller typical impact:
- Google Ads: 0.68×
- Paid Social (Generic): 0.72×
- Programmatic / Display: 0.34×
This doesn’t mean these channels don’t contribute — it means their incrementality is less consistent and more dependent on execution, targeting, and timing.
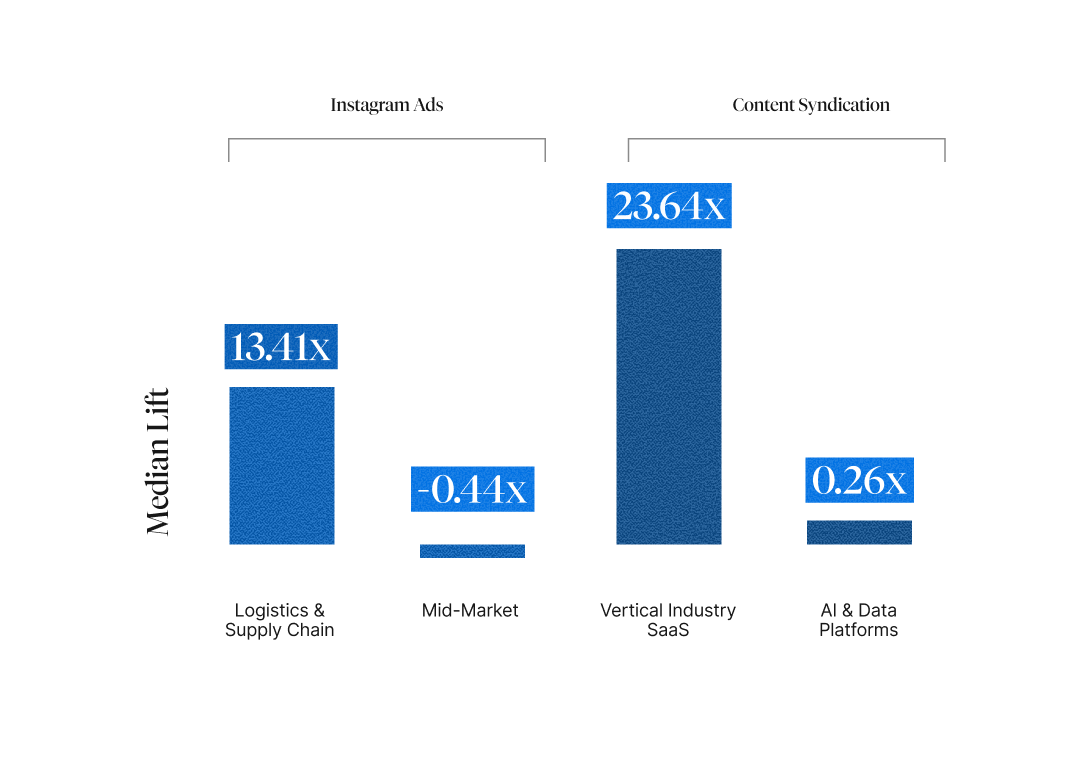
Median lift reveals another important truth: most channels are usually neutral, with occasional large wins in very specific contexts.That volatility becomes clear when we add segmentation.
- Instagram Ads
- SMB: 13.41× median lift
- Mid-Market: –0.44× median lift
- Content Syndication
- Vertical Industry SaaS: 23.64× median lift
- AI & Data Platforms: 0.26× median lift
The same channel can be transformational for one segment or industry and ineffective for another. Global averages hide these reversals.
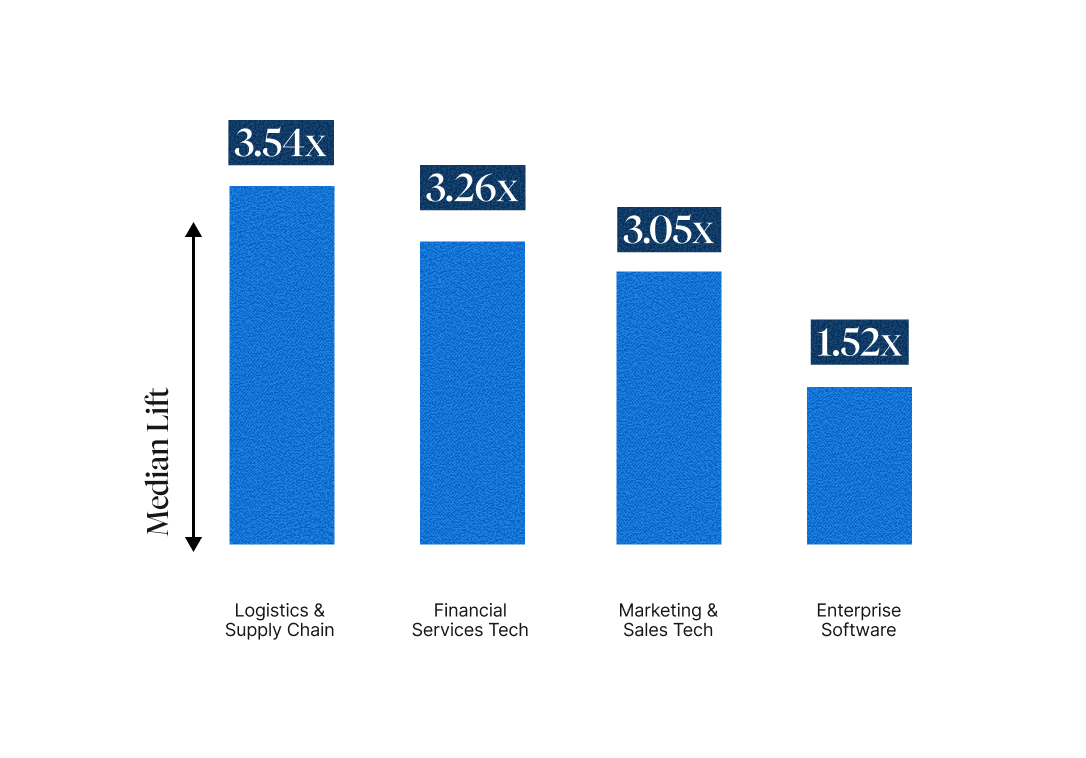
Paid Search (Generic) stands out as one of the few channels that shows consistently positive lift across a wide range of industries, even if the magnitude varies:
- Logistics & Supply Chain: 3.54×
- Financial Services Tech: 3.26×
- Marketing & Sales Tech: 3.05×
- Enterprise Software: 1.52×
Search often functions as an intent amplifier — it performs best when buyers are already in-market, and less so when education or validation is the primary barrier.
Lift reframes how channel performance should be evaluated.Channels that dominate conversion journeys are not always the ones that change outcomes. Most channels show low or neutral typical impact, with incrementality concentrated in specific segments and industries under the right conditions.
This is why benchmark-driven optimization fails. Average lift hides volatility, and global rankings obscure the fact that the same channel can be transformative in one context and ineffective in another.Lift doesn’t point to a winner.
It shows that incrementality emerges from context — from the alignment between buyer, industry, channel, and timing.
To act on this insight, we need to move beyond evaluating channels in isolation and toward understanding the engagement mix that consistently drives incremental outcomes for a given business.
what does it actually take for a lead to convert?
Across conversion rates, segments, industries, and incrementality, one pattern repeats:
There is no universal best channel.
Conversion behavior changes based on who the buyer is. Channel effectiveness shifts by industry. Incrementality depends on context, timing, and how channels work together — not on any single touchpoint.
Benchmarks collapse this complexity into averages. They can show where channels can work, but not where they will work for a specific company.
What teams actually need isn’t another ranking.
They need a way to identify the specific engagement blueprint that works for their segment, their industry, and their go-to-market motion — and to turn that insight into action.
That’s why HockeyStack built Blueprints: a configurable ML model trained on your definitions (channels, assets, segments) and your chosen conversion goal. Blueprint learns the touchpoint mix that maximizes that outcome, identifies the ideal frequency before diminishing returns, scores every target account by how close they are to that mix, and translates those gaps into clear, repeatable next-step programs your team can actually run.
Benchmarks explain the past.
Blueprints tells you what to do next.