Airbyte’s Revenue Strategy Dashboard
Tanmay’s dashboard tracks every major GTM lever that influences revenue, from pipeline generation and funnel progression to campaign ROI and content engagement.
About the Customer
Airbyte is an open standard data movement platform designed for enterprise environments. Based in San Francisco, it helps organizations centralize and sync data from hundreds of sources, enabling teams to act faster with accurate, accessible insights.
Tanmay Sarkar, Digital Marketing Manager at Airbyte, leads full-funnel inbound marketing and ABM growth strategies. As part of that, he built Airbyte’s unified marketing dashboard in HockeyStack — a strategic artifact now used across teams to measure performance, understand conversion patterns, and optimize revenue outcomes.
What Does This Dashboard Include?
Tanmay’s dashboard tracks every major GTM lever that influences revenue, from pipeline generation and funnel progression to campaign ROI and content engagement. It includes:
A detailed breakdown of inbound vs outbound pipeline generation
Funnel conversion tracking, from MQL to Closed Won
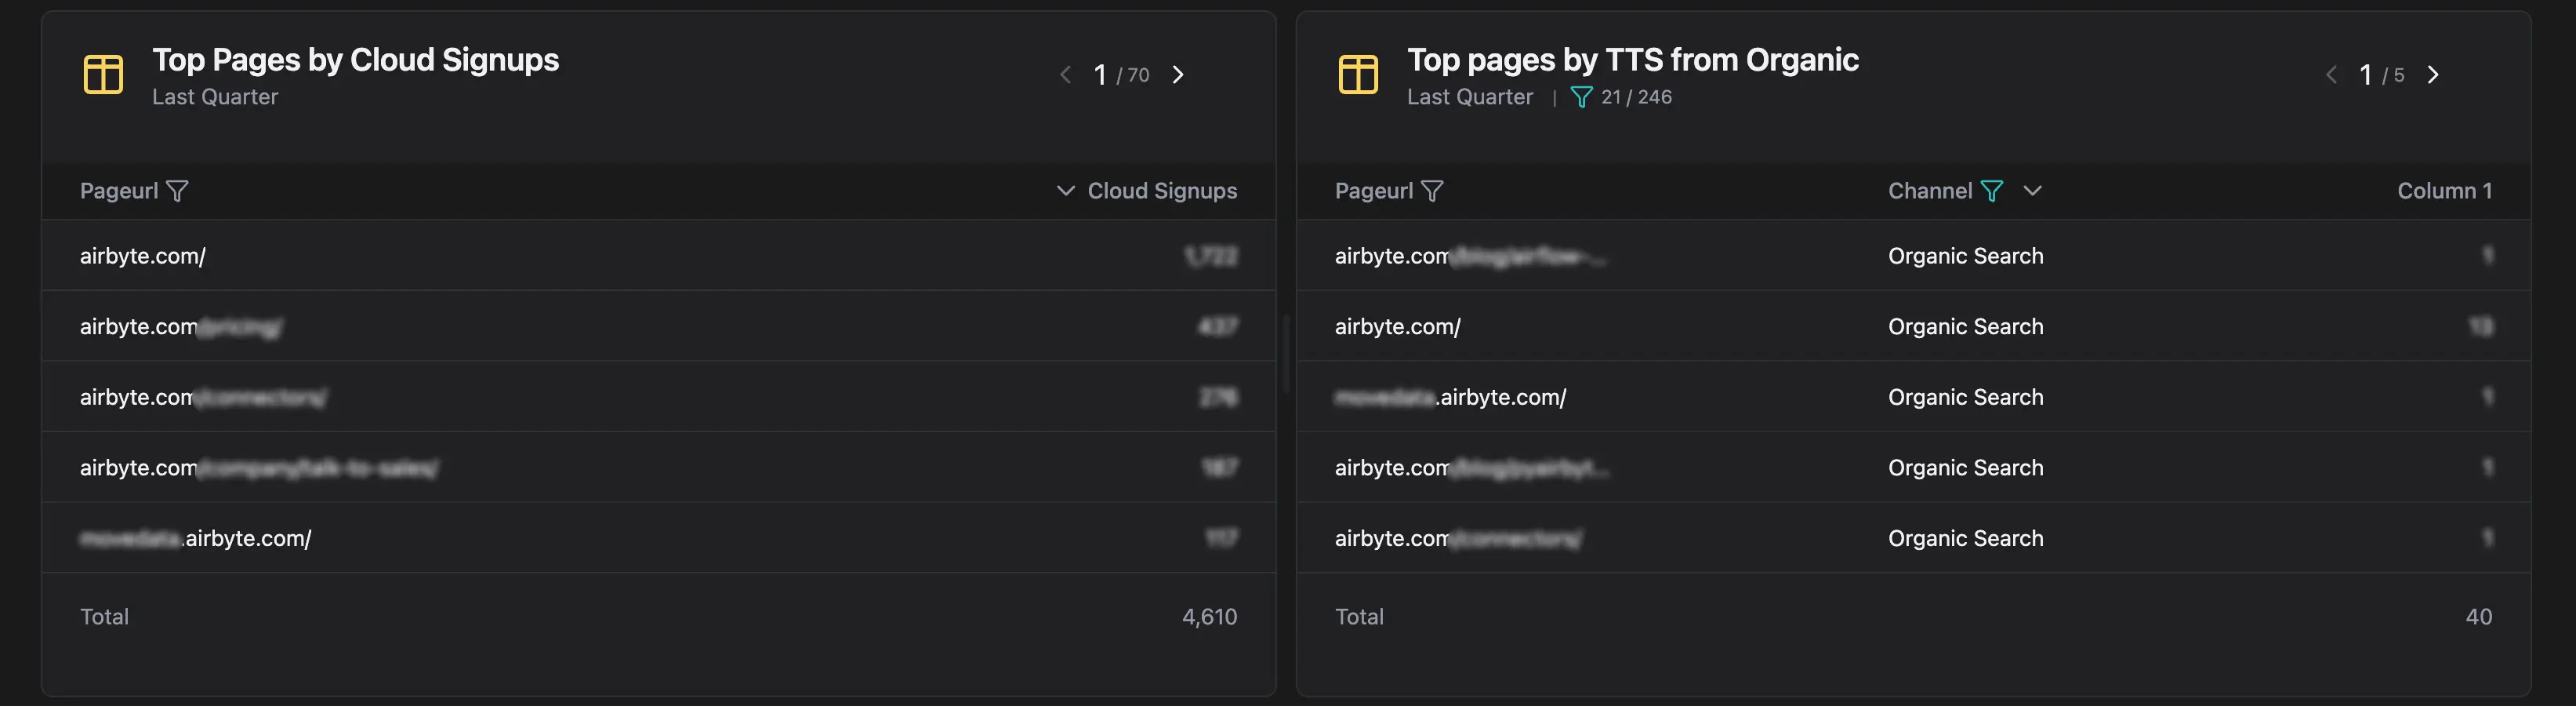
Top pages, based on first-touch and multi-touch attribution
Self-serve and sales assist revenue by channel tracking
.webp)
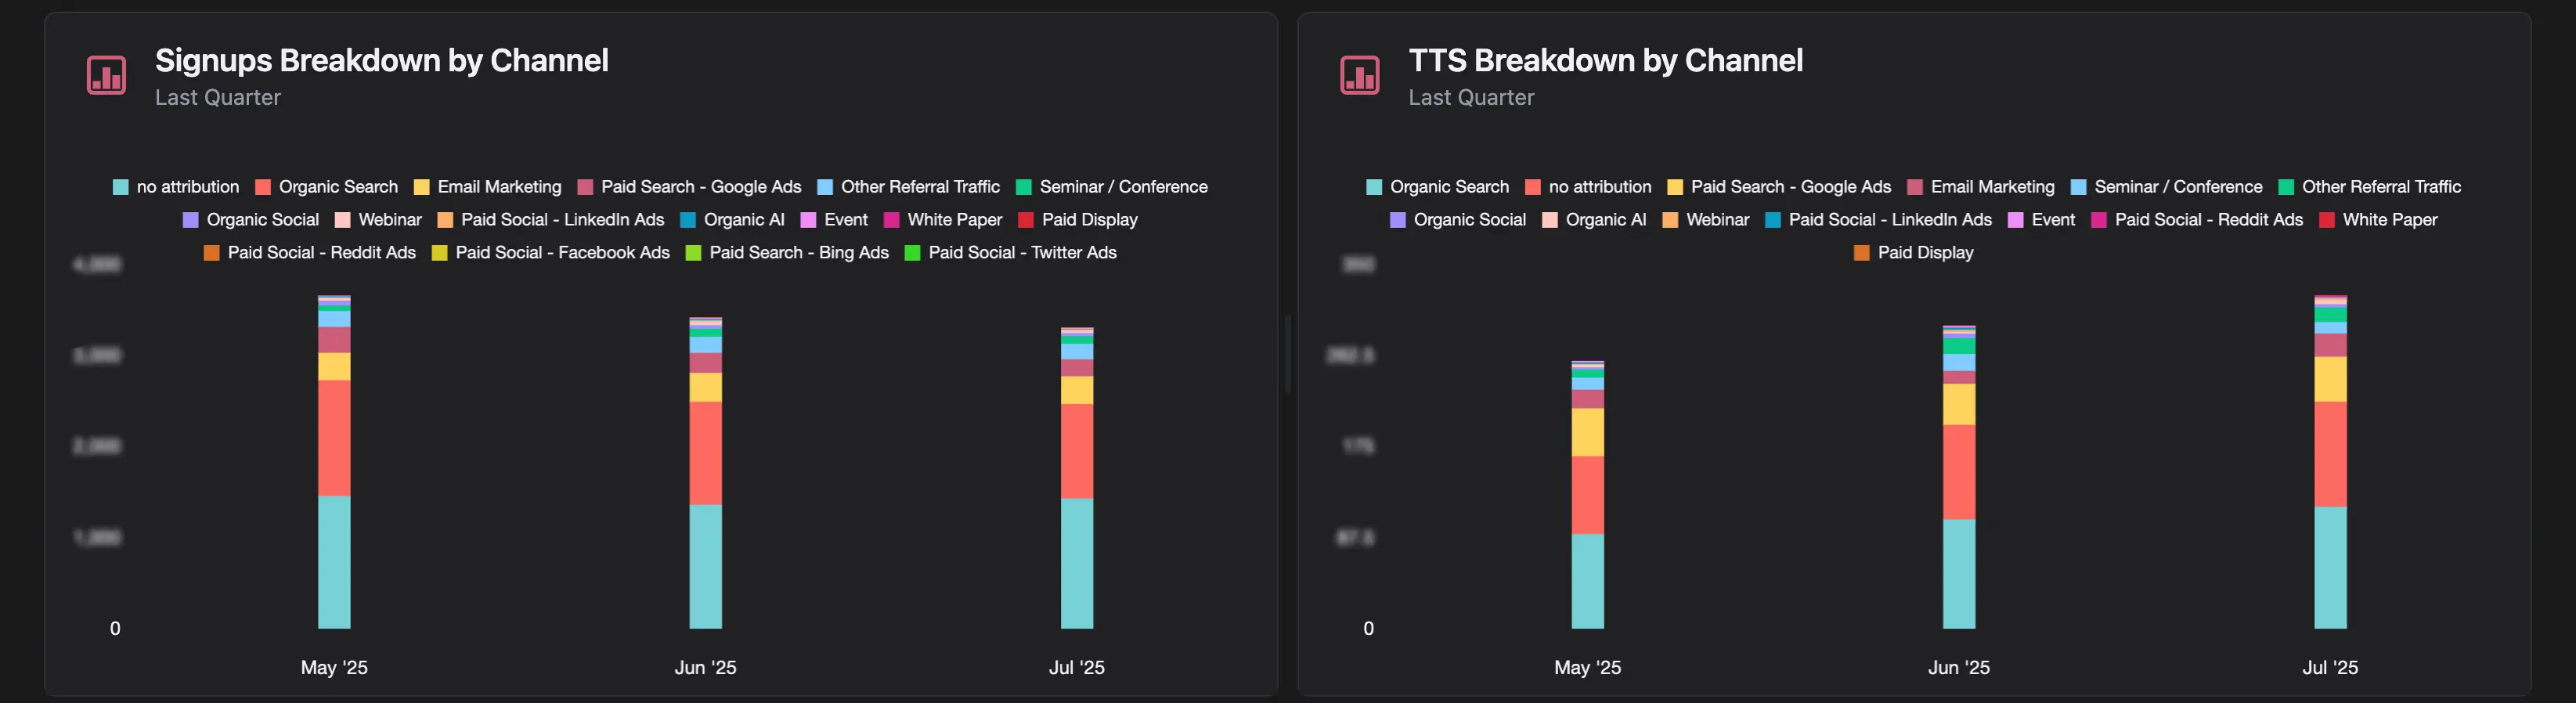
Leads by Channels
What Insights Did Odin Surface?
Tanmay uses Odin, HockeyStack’s AI analyst, for quick-turn strategic questions that would otherwise require a data request or custom dashboard. For example:
- Identifying the most influential touchpoints for recent deals
- Validating high-impact channels based on ICP engagement
- Reassessing attribution windows to align with real deal cycles
- What is the ROAS from Google ads compared to last quarter?
Instead of reporting insights post-mortem, Odin helps Tanmay act in real time. It’s used in meetings, during reviews, and for quick decisions — like adjusting ABM targeting or confirming budget allocations.
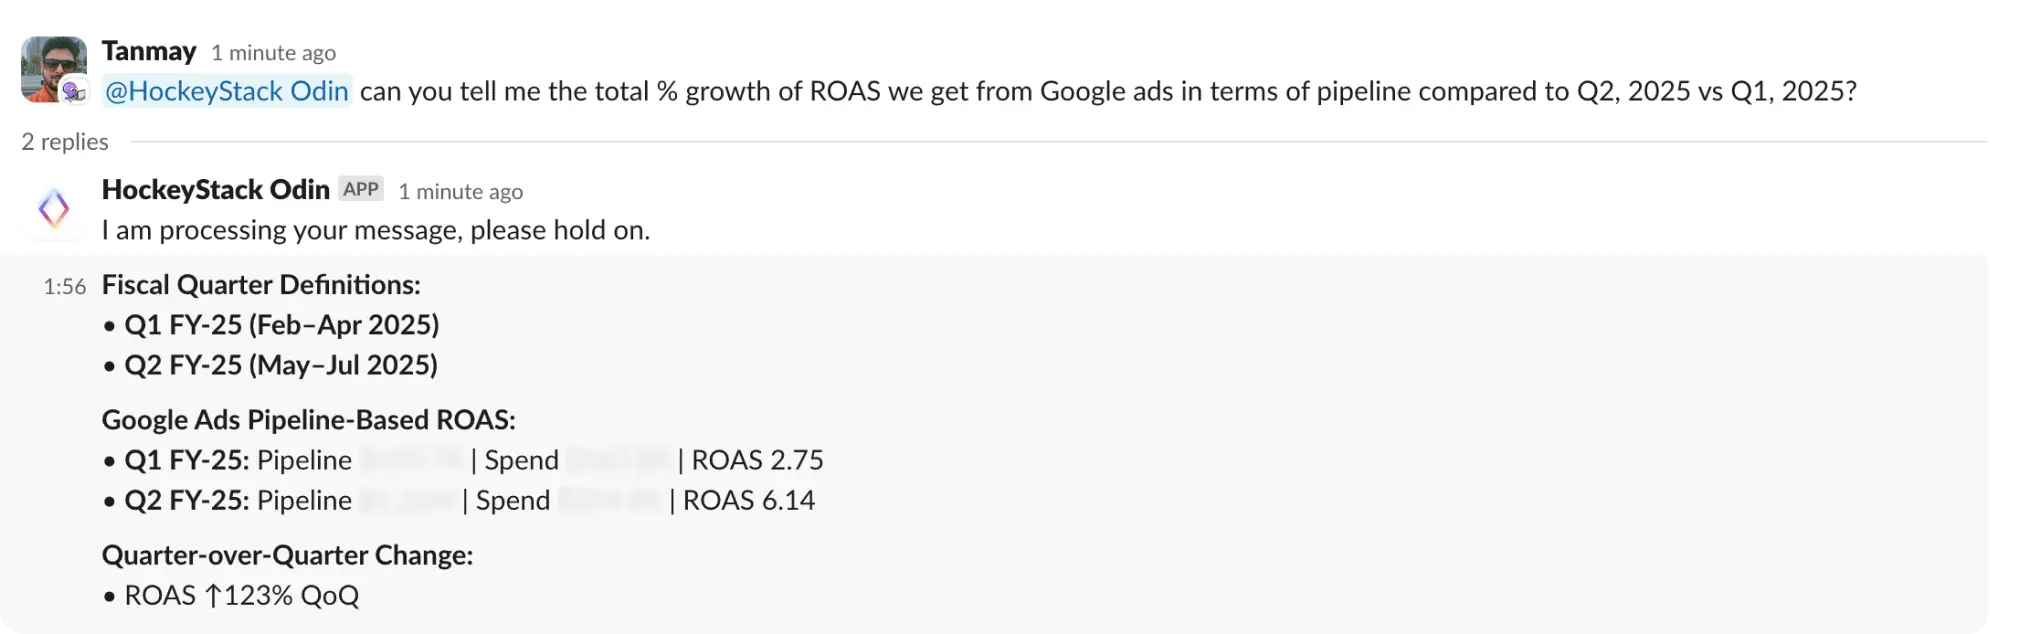
‘I use Odin to quickly pull key numbers and insights that help me make fast decisions - especially when evaluating a particular ad campaign performance data or testing a new strategy. It saves me from waiting on dashboards or digging through data manually.’
Where Tanmay Relies on Odin vs. Revenue Strategy Dashboard
How Were Those Insights Actioned?
- Organic & Referral AI Strategy: With organic traffic declining from Google and platforms like Perplexity, ChatGPT and others rising, Tanmay shifted strategy and focus based on outcome from these platforms to align with AI discovery patterns.
- LinkedIn Attribution Adjustment: Odin data revealed helped to identify that LinkedIn often influenced deals beyond a 30-day window. Attribution was extended to 90 days, resulting in better visibility into LinkedIn’s actual performance and more confident budget planning.
- Funnel Bottleneck Fixes: Drop-off analysis between funnel stages revealed key bottlenecks, enabling us to run more effective CRO experiments and launch targeted nurture campaigns that boosted conversions.
- Goal-Driven Prioritization: Using HockeyStack’s ‘Goals’ feature, Tanmay and team tracked progress against quarterly pipeline and revenue targets — focusing efforts on shortfalls early rather than recapping late.
Business Outcomes
The combined impact of dashboard analysis and Odin insights led to:
- More accurate attribution of long-cycle channels, improving ROI modeling
- Faster reporting and insight generation, reducing dependency for data team
- Improved pipeline conversion rates through targeted funnel stage interventions
- Clearer strategic focus, driven by real-time progress tracking toward quarterly goals
- More aligned ABM campaigns, informed by multi-touch engagement patterns
Full Dashboard