Stocksy Enterprise PLG Dashboard
Stocksy’s Senior Marketing Operations Specialist, Masagi Sinnott, built an Enterprise Pipeline Dashboard in HockeyStack to track inbound business form submissions, their sources, and their impact on revenue. By pairing these dashboards with HockeyStack's quick AI insights, Masagi is able to connect marketing, sales, and customer success data into one view—driving faster deal cycles, smarter budget allocation, and stronger cross-team alignment.
About the Customer
Stocksy is an artist-owned cooperative that provides royalty-free, human-created stock imagery, with 50–75% of royalties going back to the creators. Their carefully curated library of authentic, non-generic visuals serves diverse agency and enterprise clients. They also support clients with bespoke content, creative consultations, and custom curations.
Masagi Sinnott is the Senior Marketing Operations Specialist on the Growth Team at Stocksy United. She bridges sales, marketing, and customer support operations to create seamless customer experiences from lead creation through deal closure and repeat purchases. Her work spans reporting, MarTech support, campaign and project support, with a recent focus on connecting analytics tools like HockeyStack to make customer insights more actionable.
What Does this Dashboard Include?
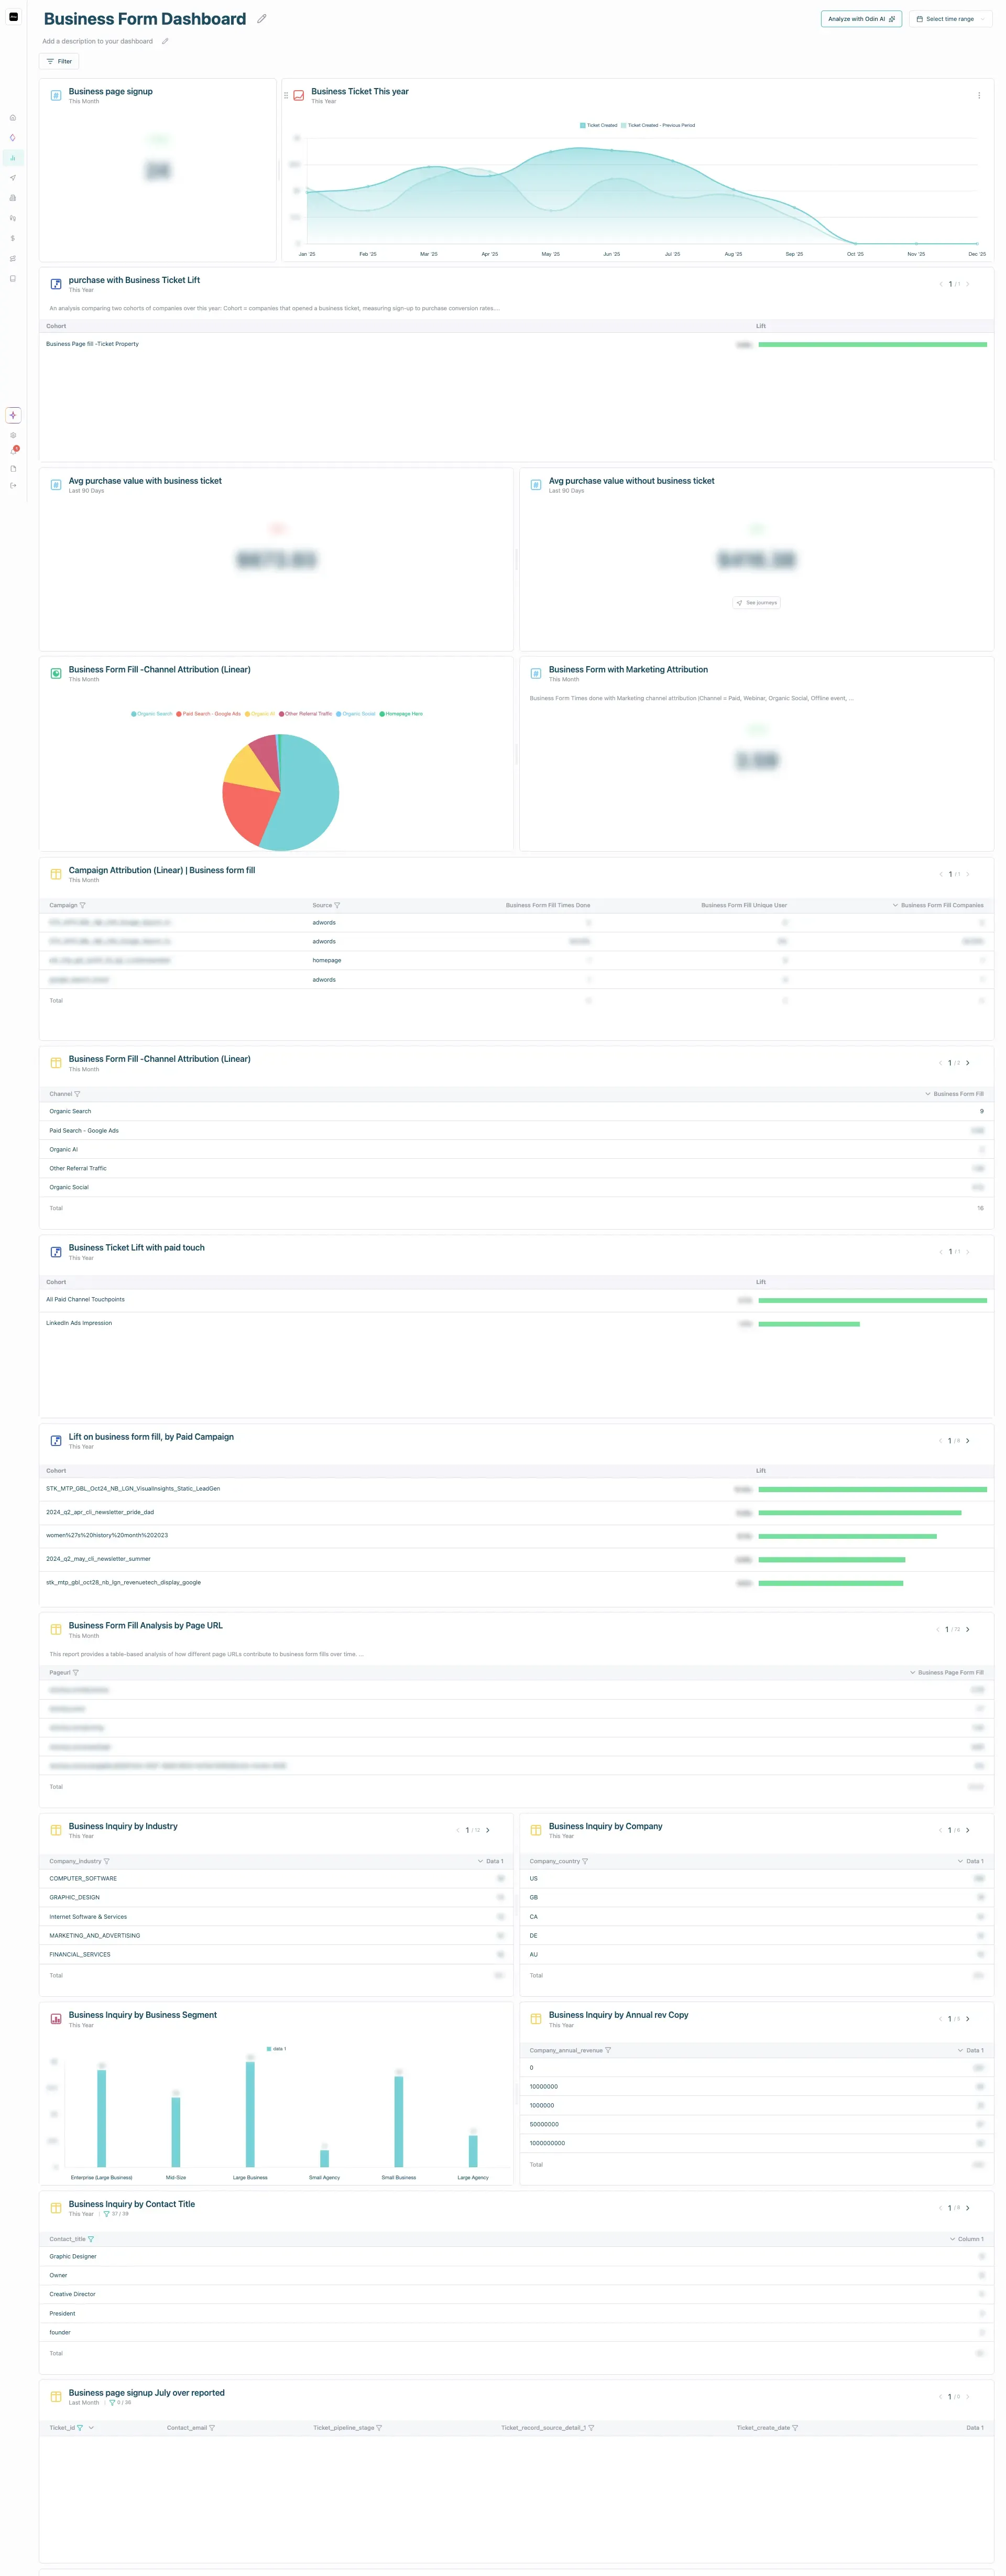
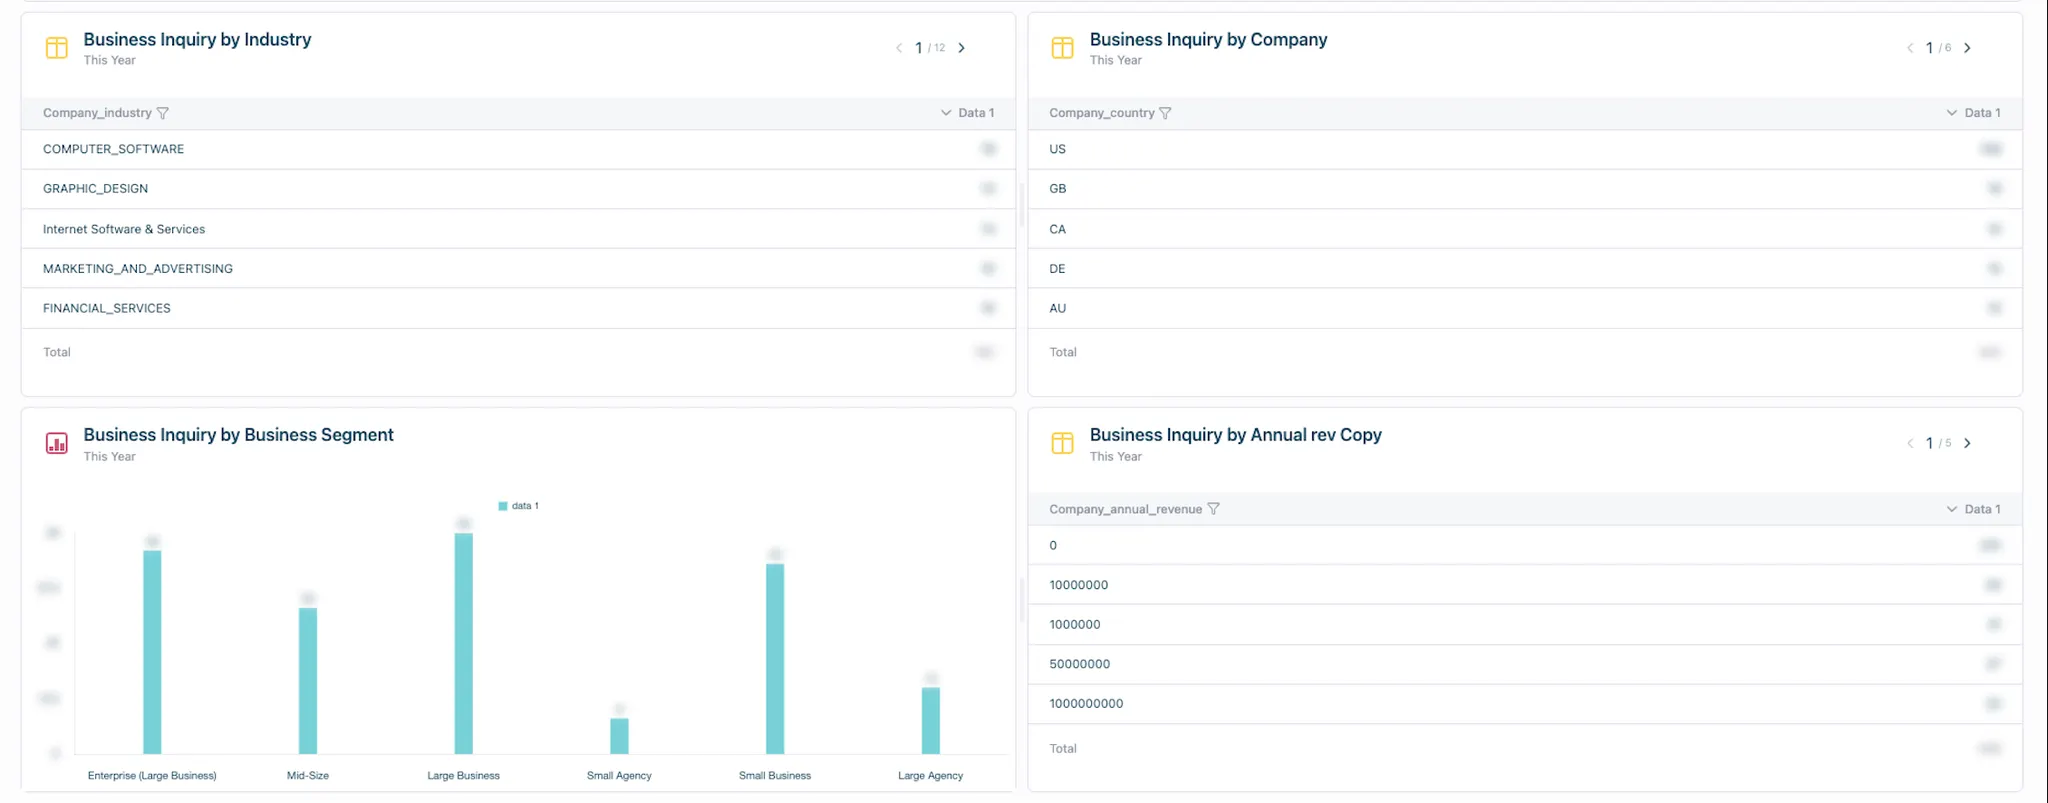
Masagi’s Enterprise Pipeline Dashboard is designed to measure the enterprise business form submissions that come inbound, their sources, and how they translate to revenue. Here’s what it measures, across different sections (metrics anonymized for privacy):
Form Submissions and Trends
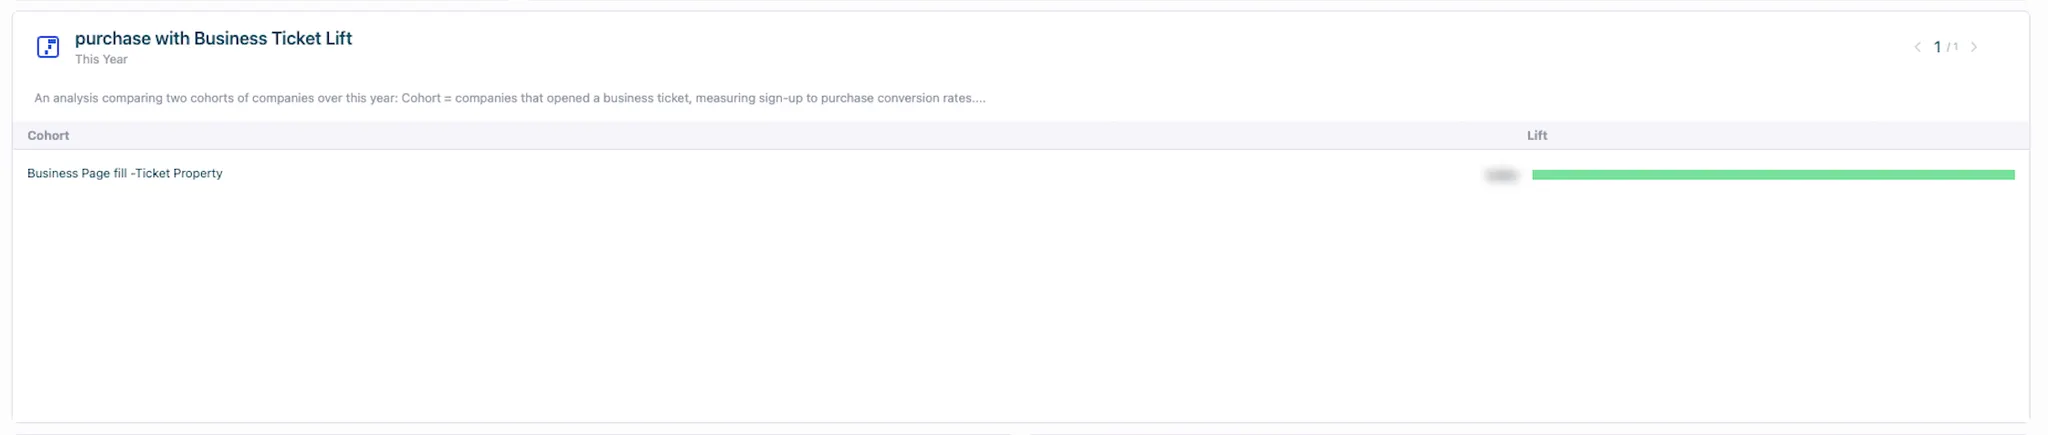
Business Form Conversion Lift
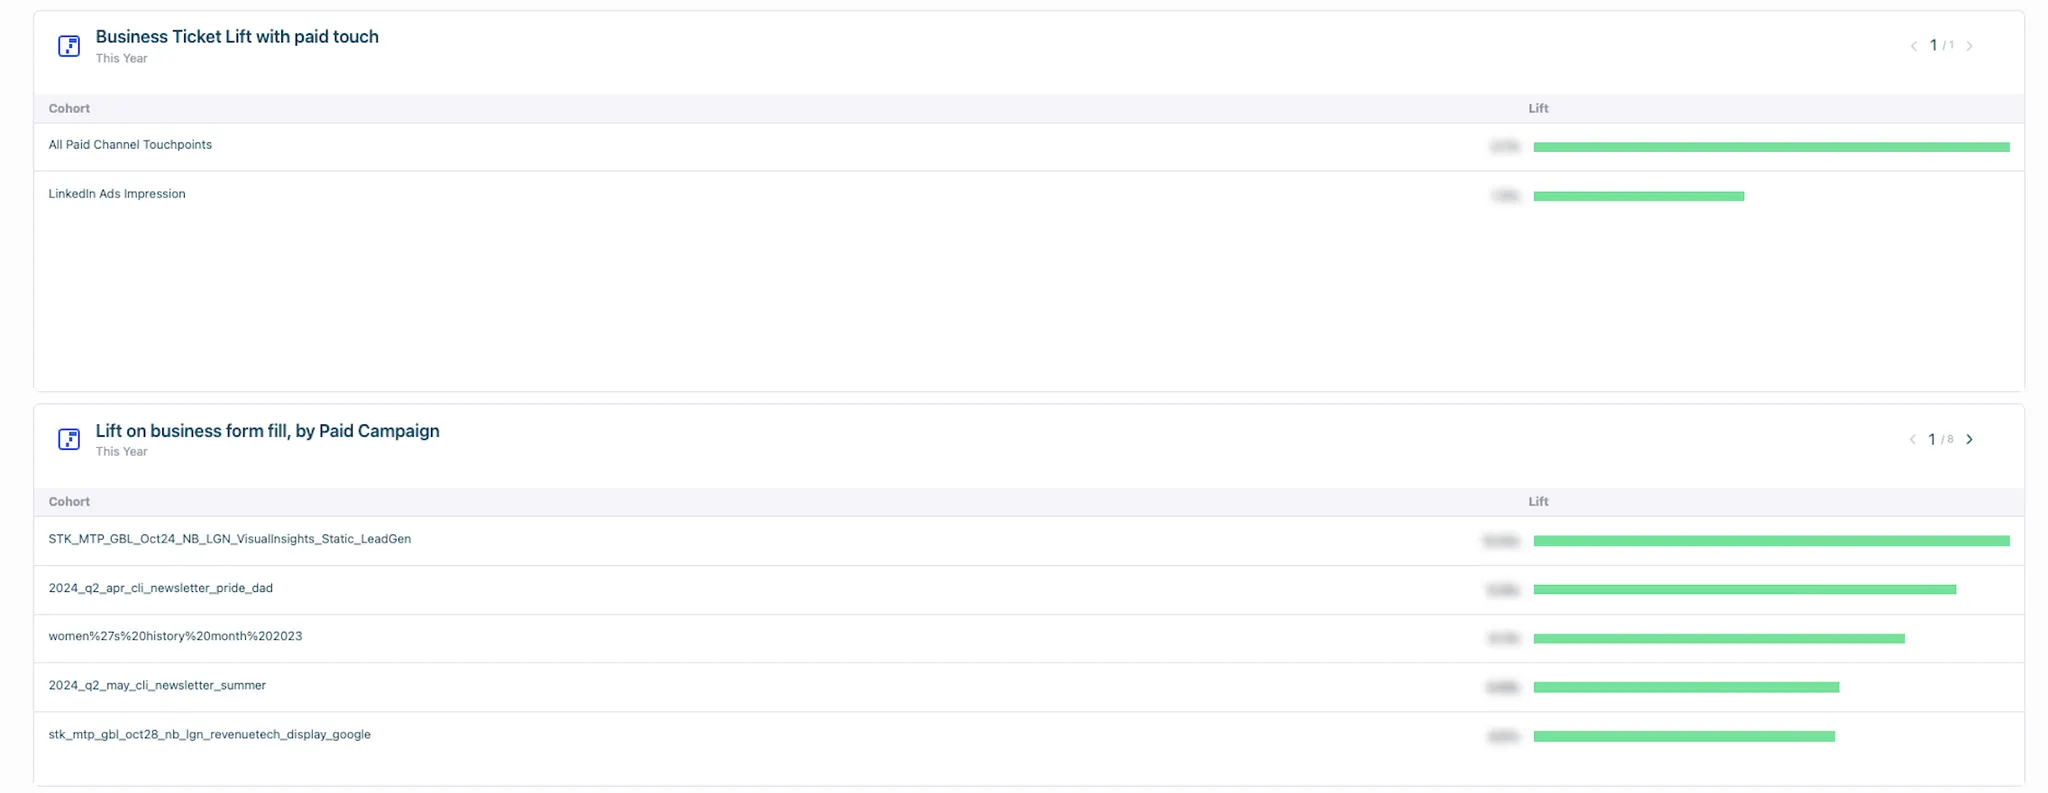
Lift of Paid Touches on Form Fills
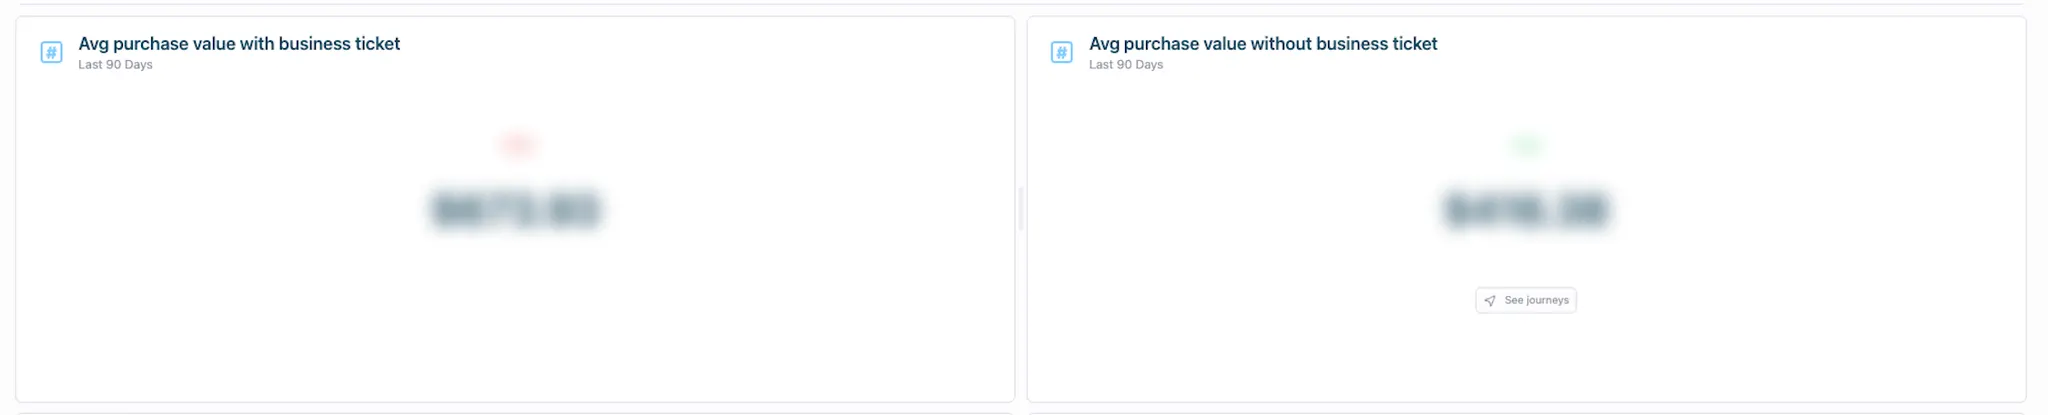
Purchase Values
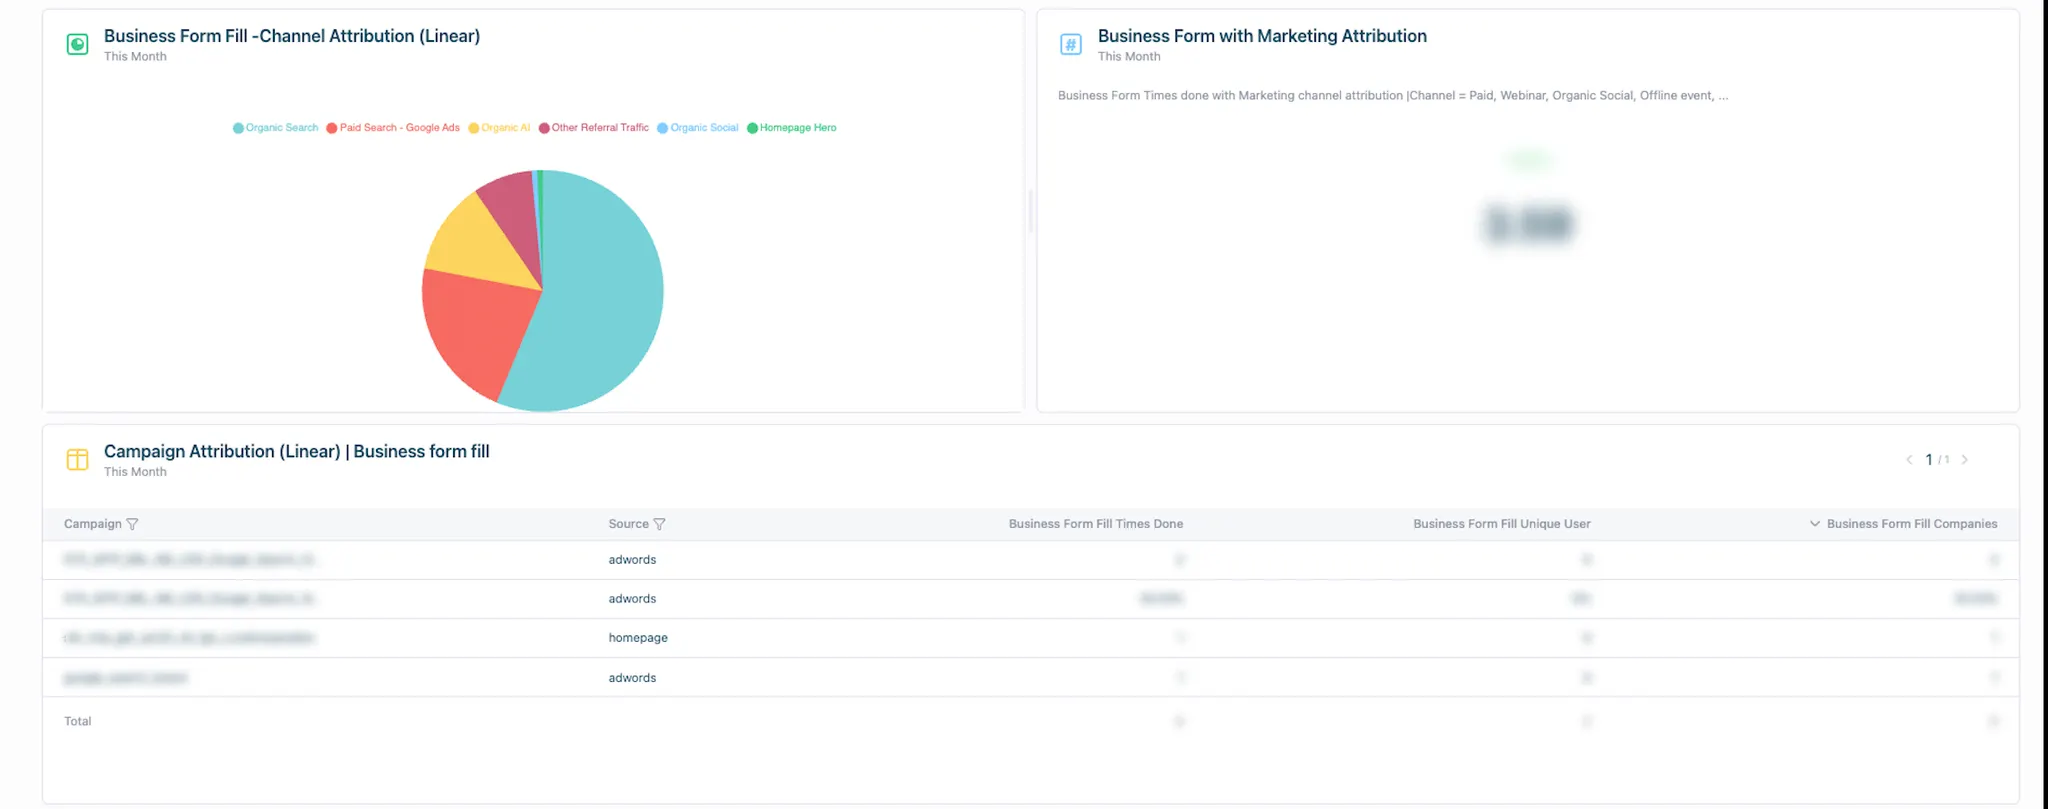
Business Form Fill Attribution
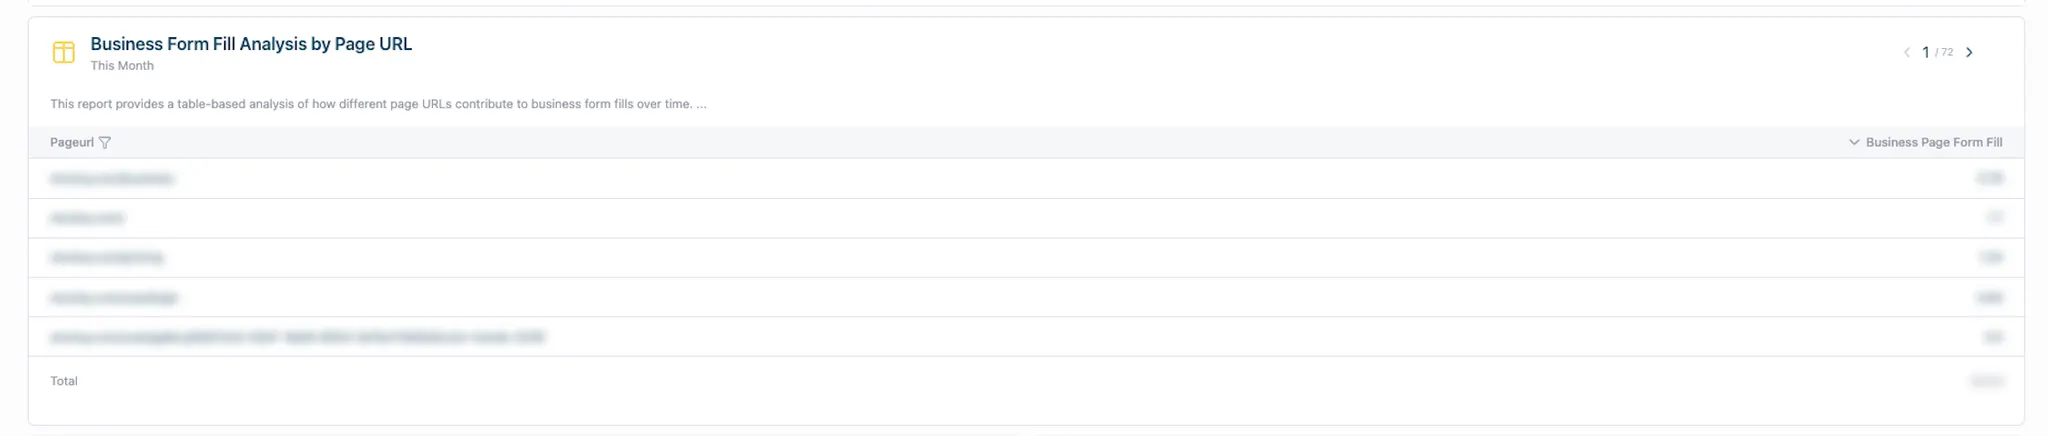
Webpage Impact on Form Fills
Customer Profile Analysis
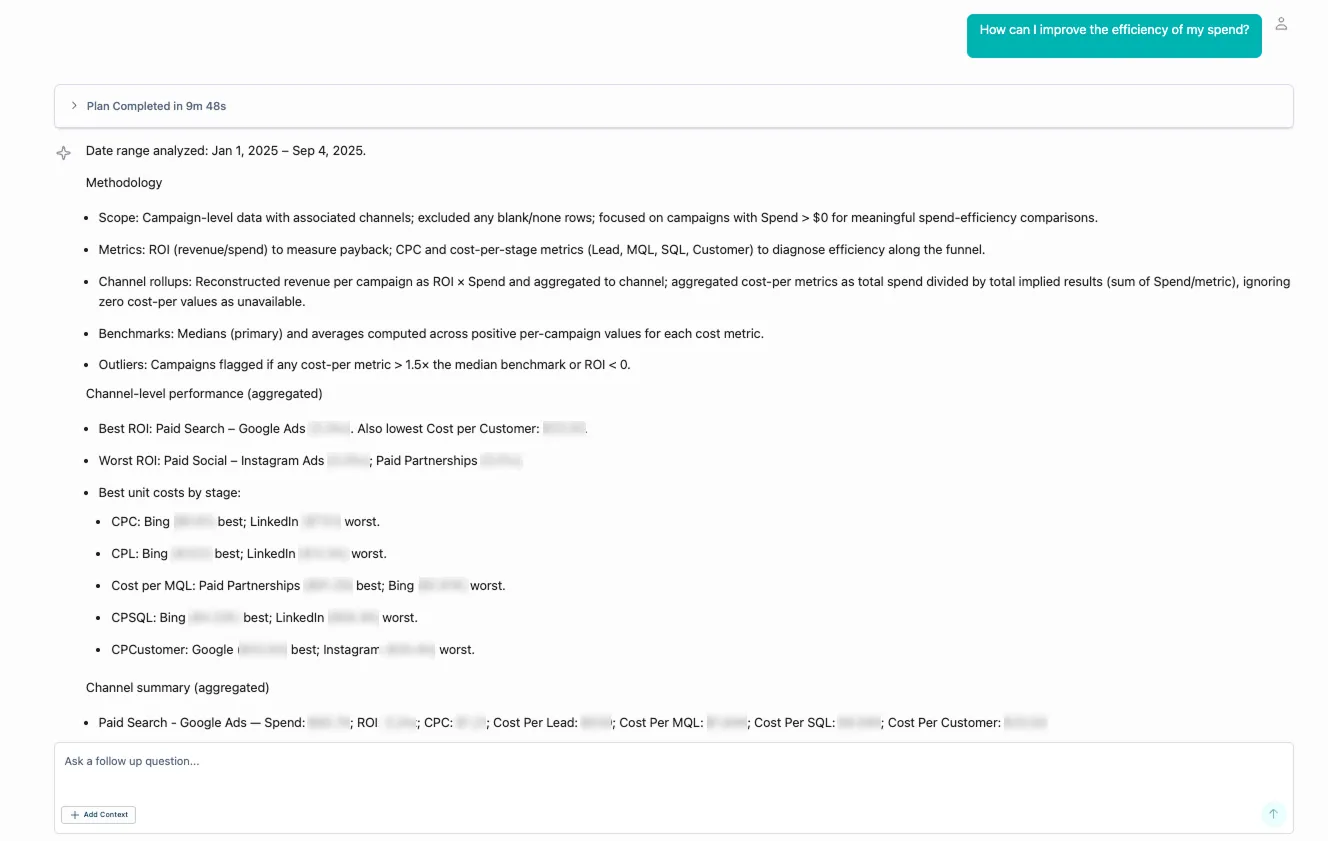
What Insights Did Odin Surface?
For Masagi, Odin has become a helpful companion alongside her dashboards. She often taps into it for quick support and lightweight analysis that saves her time:
- Quick insights from dashboards: Masagi described it as “super impressive” that she can hand Odin a dashboard and get back clear, actionable takeaways like “Hey Masagi, this is what I see… this is what you can do.”
- Everyday AI assistant: Odin’s become “a great pal” and Masagi shared that she uses it a lot for fast, on-demand answers.
- Evolving experience: Masagi has noticed the interface continuously improving, making it easier to explore insights.
- Supplementary tool: After building dashboards manually, she occasionally asks Odin for added context, showing how it fits naturally into her analytics workflow.
Where Masagi Relies on Odin vs. Stocksy Dashboards
How Were Those Insights Actioned?
- Enterprise Pipeline Tracking: By consolidating form submissions, conversion rates, and purchase values into one view, Stocksy can now clearly measure the impact of enterprise business form fills versus self-serve customers.
- Channel & Campaign Attribution: Visibility into which channels and campaigns drive revenue helps the digital marketing manager allocate budget toward high-performing sources.
- Audience Segmentation: Insights into company size, industry, and job titles of form submitters give the team a sharper picture of who’s engaging and allow more precise targeting in future campaigns.
- User Journey Insights: HockeyStack enables tracking of the complete user journey across multiple touchpoints (on both user and company level), providing visibility into how each marketing effort contributes to visits and engagement
Business Outcomes
The impact of Stocksy’s dashboards and analysis has been clear:
- Proven enterprise value and faster sales velocity, with key engagements like business form submitters showing much higher conversion rates and higher average purchase values, and faster, more confident deal closures
- Optimized budget allocation, as insights guided spend toward campaigns with stronger ROI
- Unified reporting, replacing fragmented platform data with a single source of truth across marketing and sales
- Stronger cross-team alignment, as marketing, growth ops, and account managers work from the same insights to guide strategy
Full Dashboard